Monitoring Results
Wetland Condition
California Rapid Assessment Method (CRAM) data and other indicators of wetland development and health
Monitoring a wetland’s condition is a way of describing its health and assessing how it compares to similar wetlands. California Rapid Assessment Method (CRAM) provides a cost-effective snapshot of habitat condition, capturing wetland changes over time and factors driving them in a method that can inform restoration project design.
CRAM is an efficient assessment tool for monitoring the health of tidal wetlands. CRAM provides information about the condition of a wetland and the stressors that affect it that can be applied at different scales: site, region, Estuary-wide. It can be used to develop a picture of healthy conditions for a particular wetland type or to create a landscape-level score of the conditions of wetlands within a region of interest.
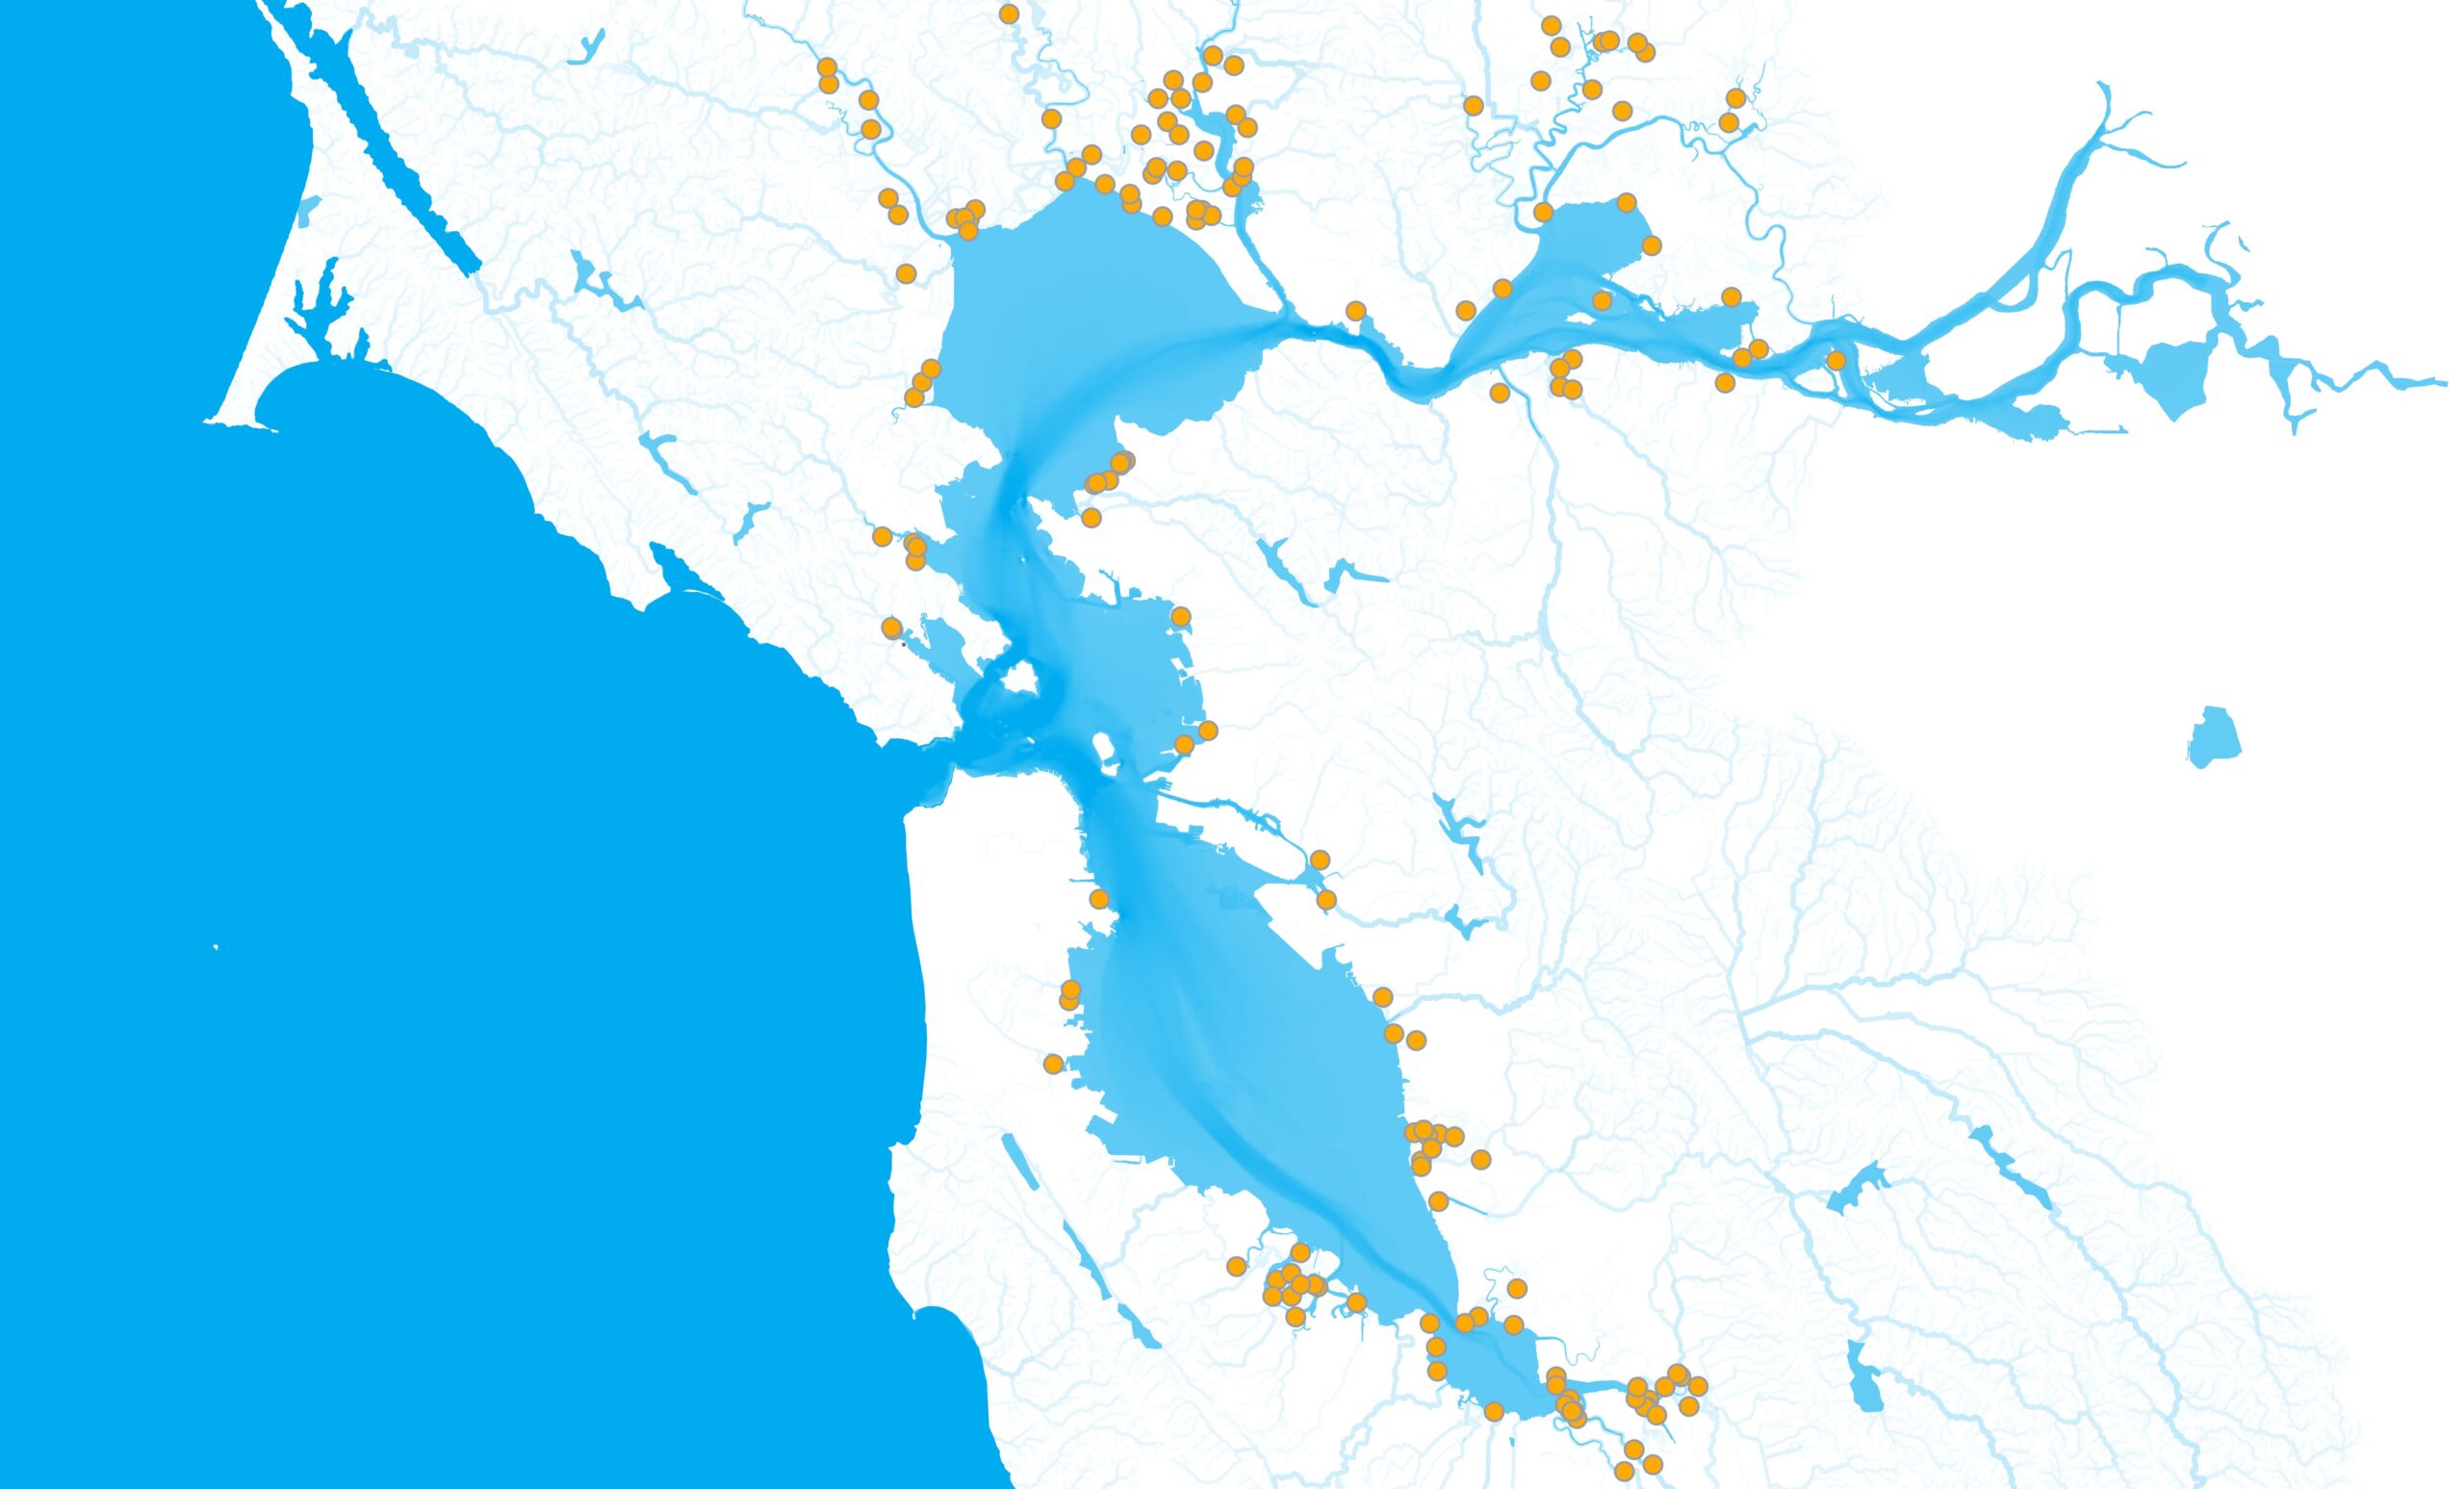
CRAM has been conducted for multiple WRMP Priority Network Sites, and the WRMP aims to continue conducting CRAM throughout the Estuary, focusing on areas with assessment gaps, to track progress towards 100,000 acres of healthy tidal wetlands.
CRAM monitoring at Liberty Island. SFEI
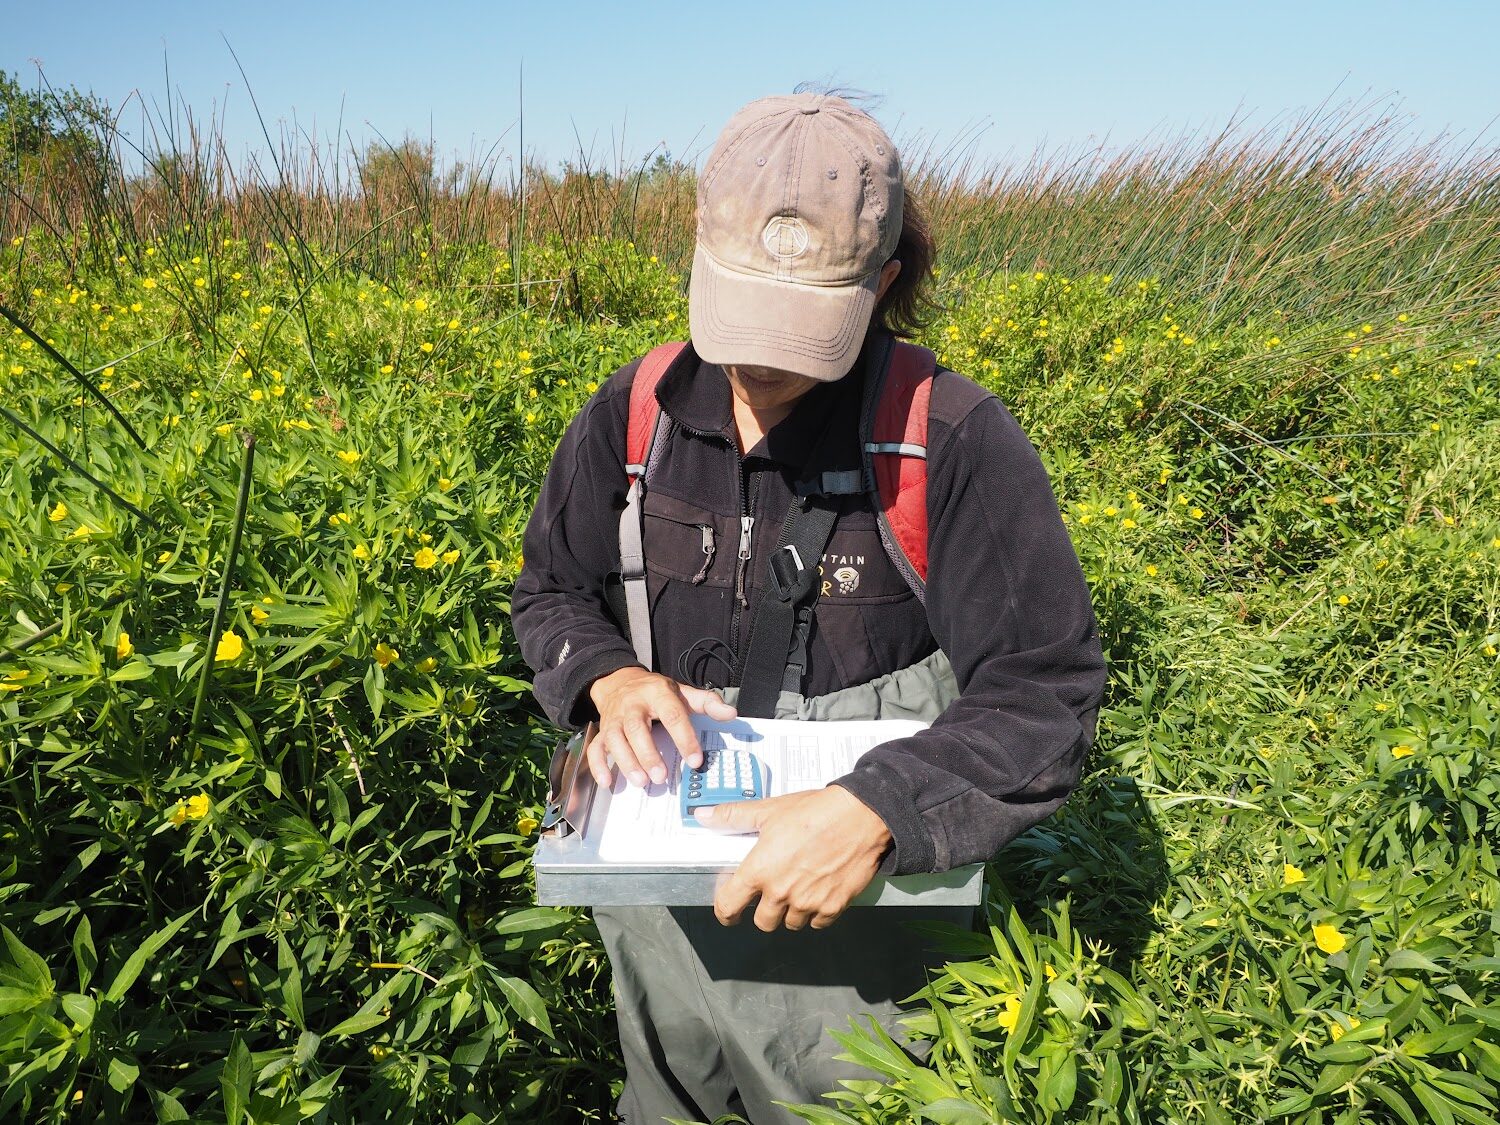
Scientists conducting a CRAM survey. S. Pearce.
Wetland Condition
Challenge & Response
Strategic management of the Estuary starts with knowing the overall ecological condition of its tidal wetlands, understanding how that condition varies across the Estuary and over time, and identifying which areas might not have enough information to accurately characterize the condition.
In 2024, the WRMP summarized all tidal wetland CRAM data that had already been collected in the Estuary; this effort was called a retrospective study of existing historical data. This analysis was used to evaluate and compare tidal wetland conditions across space and time in the Estuary. During this effort, the WRMP identified the data gaps where there were not enough CRAM surveys to understand the tidal wetland condition in that region. The WRMP then began collecting additional CRAM data to fill these gaps and developed an Estuary-wide CRAM survey plan that will fill key data and information gaps to measure wetland condition in the whole Estuary. Learn about CRAM fieldwork in the Case Study examples.
Science Framework
CRAM is an integral part of the WRMP Science Framework, addressing the condition of wetlands across the Estuary in a way that can track change in condition over time.
- What new information do we need to better understand regional lessons from tidal marsh restoration projects, advance tidal marsh science, and ensure the continued success of restoration projects?
Wetland Condition
Key Metrics & Figures
The WRMP is tracking wetland conditions in the Estuary through quantitative metrics derived from CRAM surveys. The overall CRAM score, which measures overall ecological condition, takes into account sub-scores for surrounding habitat, hydrology, physical structure of the wetland, and the types of plants and animals present.
Looking for local data and information?
Metrics describe how the WRMP conducts science to better understand and monitor the Estuary’s tidal wetlands, like water quality, fish habitat, wetland condition, and benefits to humans. Explore all the WRMP’s metrics, which aim to guide wetland management and restoration.
Wetland Condition
How We Monitor
Two or more trained practitioners use CRAM to assess the overall health of a wetland by choosing condition scores from a set of descriptions that match the conditions observed in the field.
Wetland condition monitoring using California Rapid Assessment Method (CRAM)
1
A CRAM survey in the Central Delta. SFEI
Goals and objectives
- Implement a cost-effective and scientifically defensible monitoring method that provides a snapshot of habitat condition.
- Capture wetland condition change over time.
- Identify factors driving changes in tidal wetland evolution to inform restoration project design.
2
CRAM monitoring at Liberty Island. SFEI
What data we collect
- Information on biological and physical characteristics that support fish and wildlife.
- Data on the size and location relative to other wetlands to understand habitat connectivity.
- Key metrics of hydrology, such as the water source, hydroperiod and connectivity to surrounding areas.
3
WRMP
Where we collect it
- Centuries-old tidal wetlands representing Benchmark sites.
- Mature older restored wetlands or those naturally formed in the last century referred to as Reference sites.
- Newly restored wetlands that are still developing called Projects sites.
4
CRAM calculations in the Delta. Photo by SFEI (unknown)
What insights we expect
- Understanding of overall ecological health, or condition, of tidal wetlands in the WRMP area.
- Estuary-wide frame of comparison for restoration projects.
- Ability to track regional change in tidal wetland condition over time.
Wetland Condition
2024 WRMP CRAM fieldwork
case study
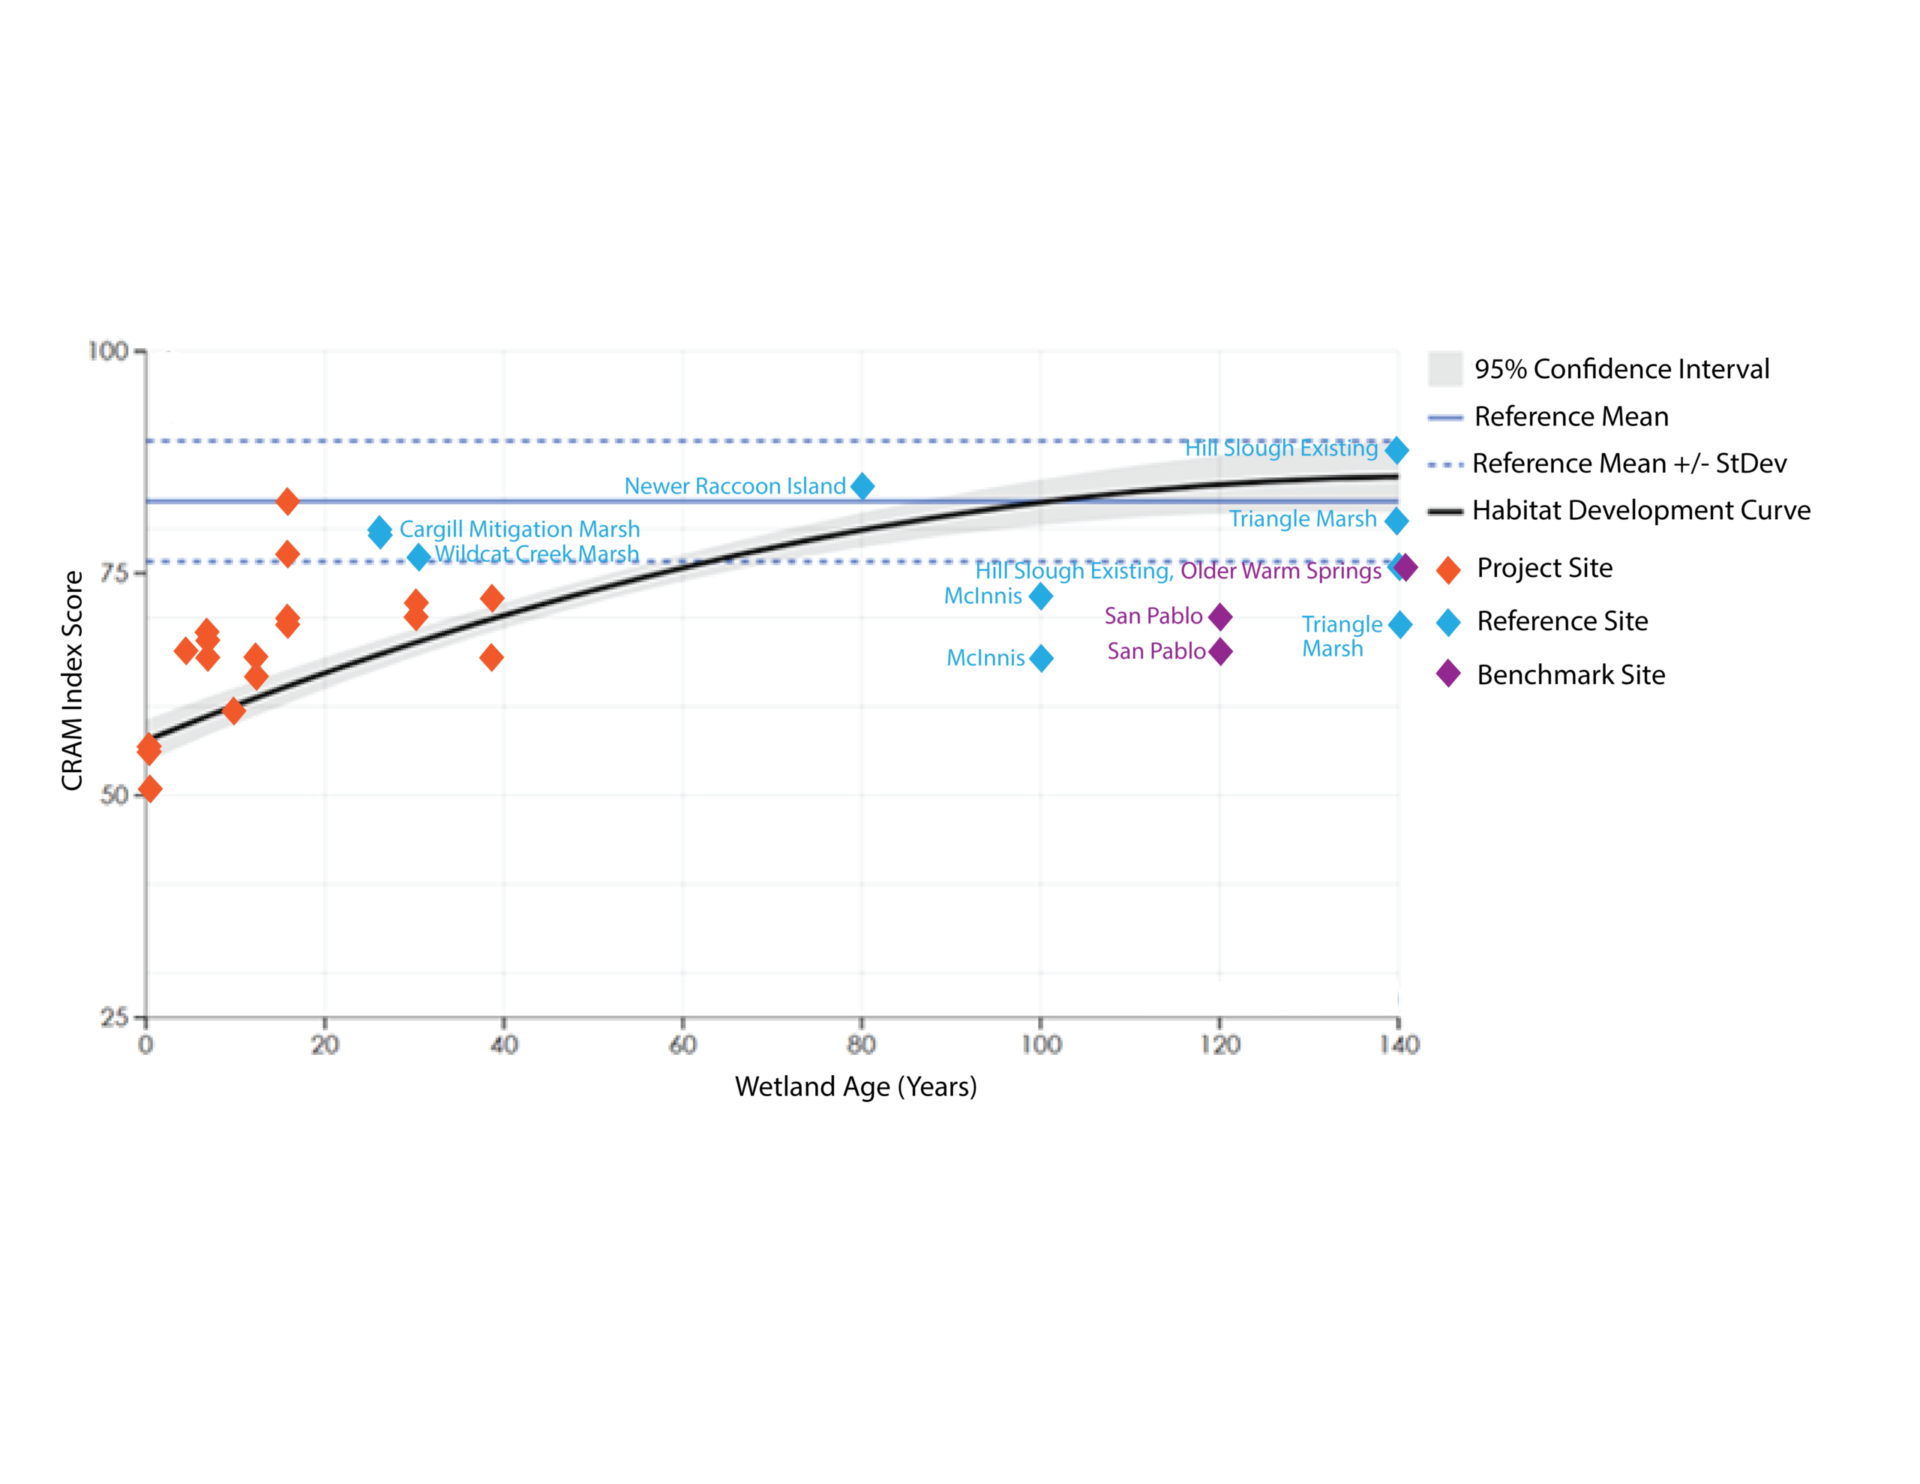
Fieldwork for WRMP CRAM assessments started in 2024. The goal was to gain additional spatial coverage of wetland condition data using CRAM across the WRMP Priority Site Network, targeting twenty-one Priority Network Sites where no CRAM data existed. By the end of the 2024 field season, a total of 33 new CRAM assessments were completed at 18 Priority Network Sites, representing a 45% increase in the total number of CRAM assessments within the Priority Network. For these 33 new assessments, CRAM scores indicated wetland sites in both fair and good condition. Notably, every newly-restored wetland that was assessed was in fair condition, which is to be expected; these projects have all been completed recently, and it is known that tidal marsh habitat takes time to mature and improve in condition. These 2024 assessments will allow for tracking changes in condition through time. Nine of the 33 assessments were in good condition, all of which were in Benchmark (historic marsh) and Reference (well-established restoration) Sites. More CRAM assessments will be completed in 2025, aiming to continue to fill in the spatial gaps where no CRAM data exists.
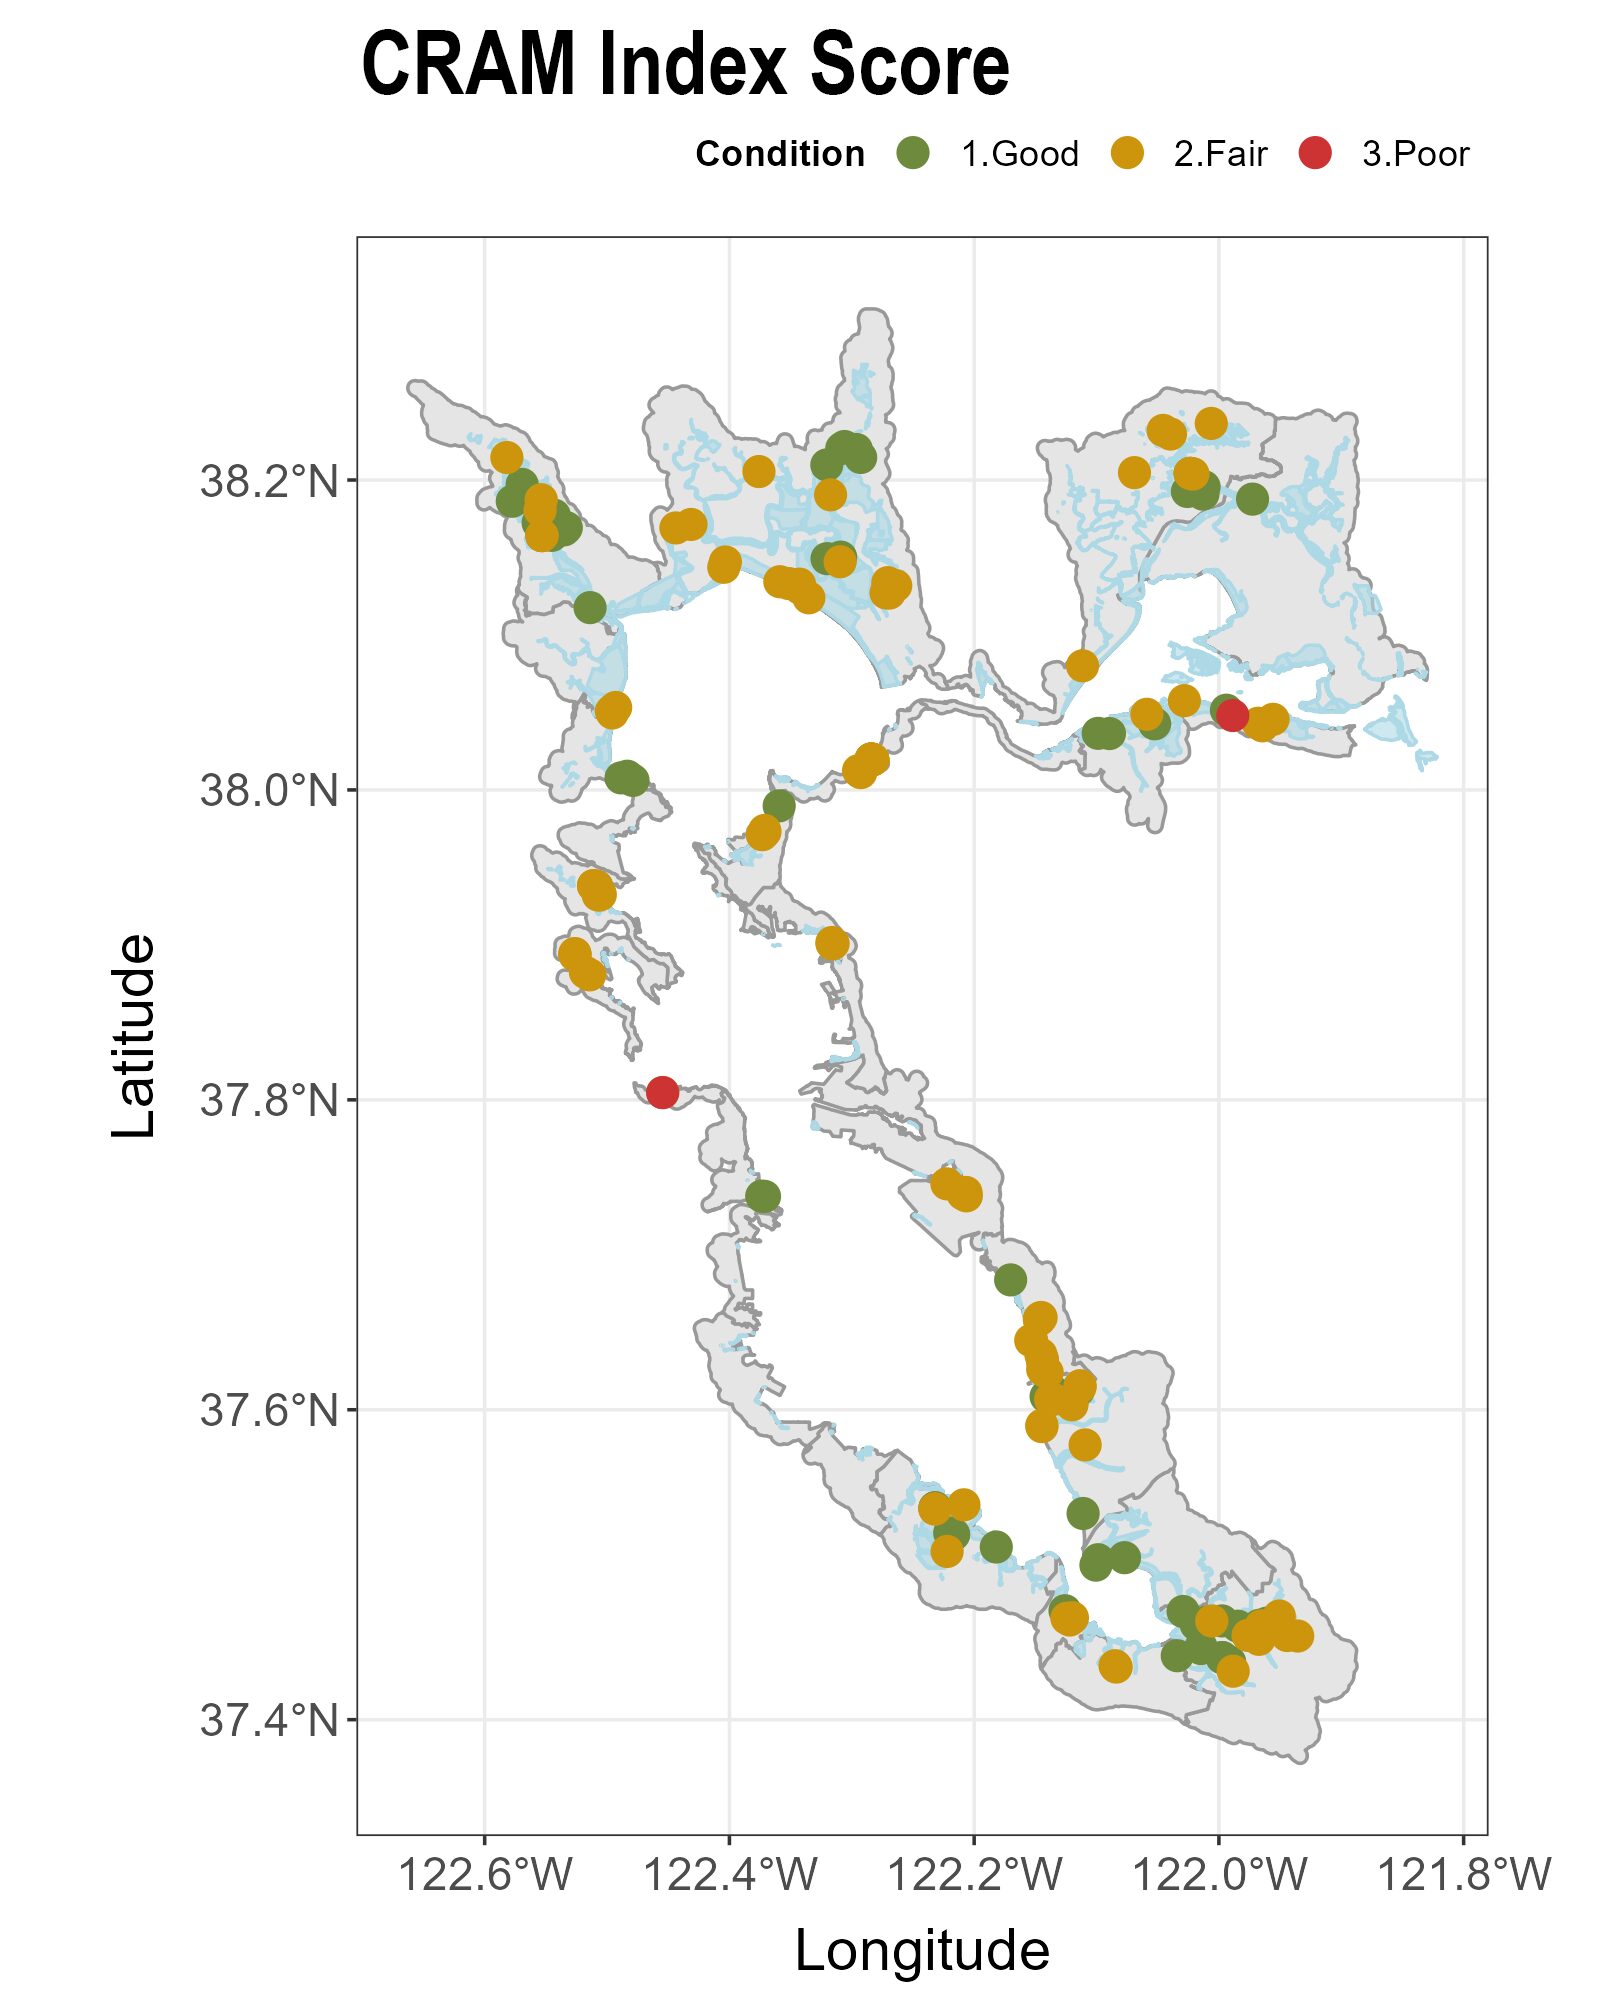
Map of CRAM locations and Index scores. SFEI
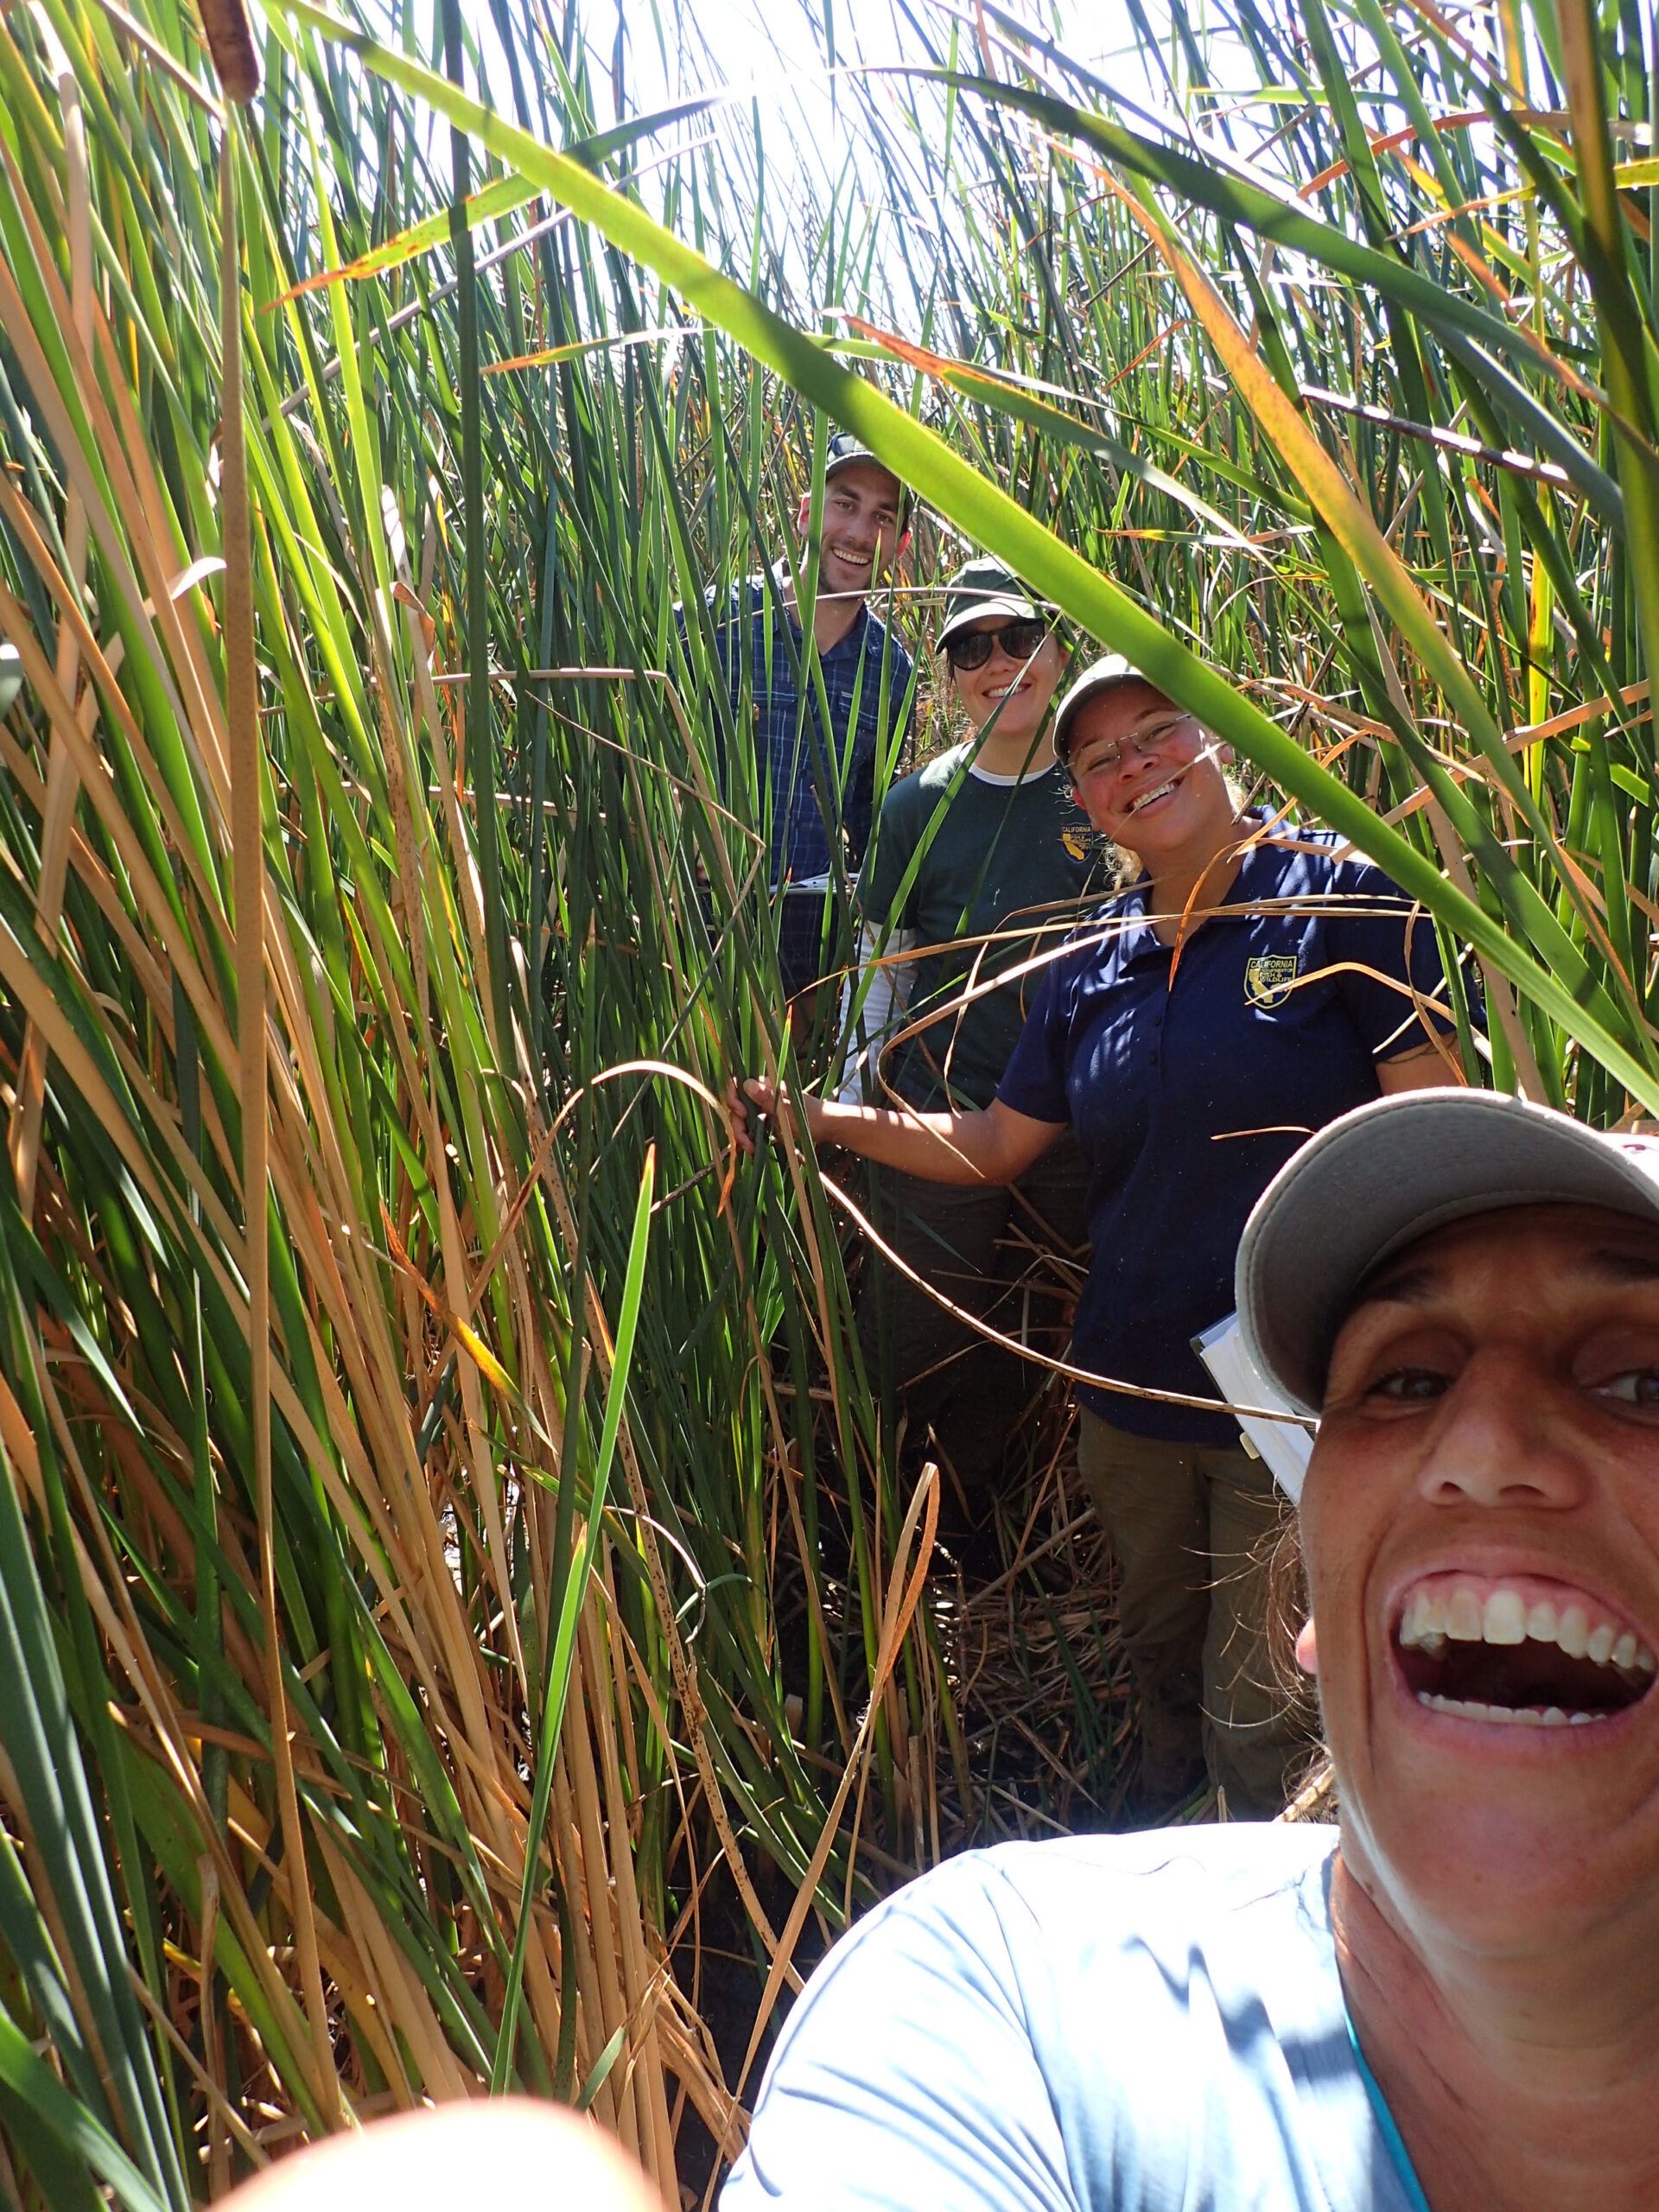
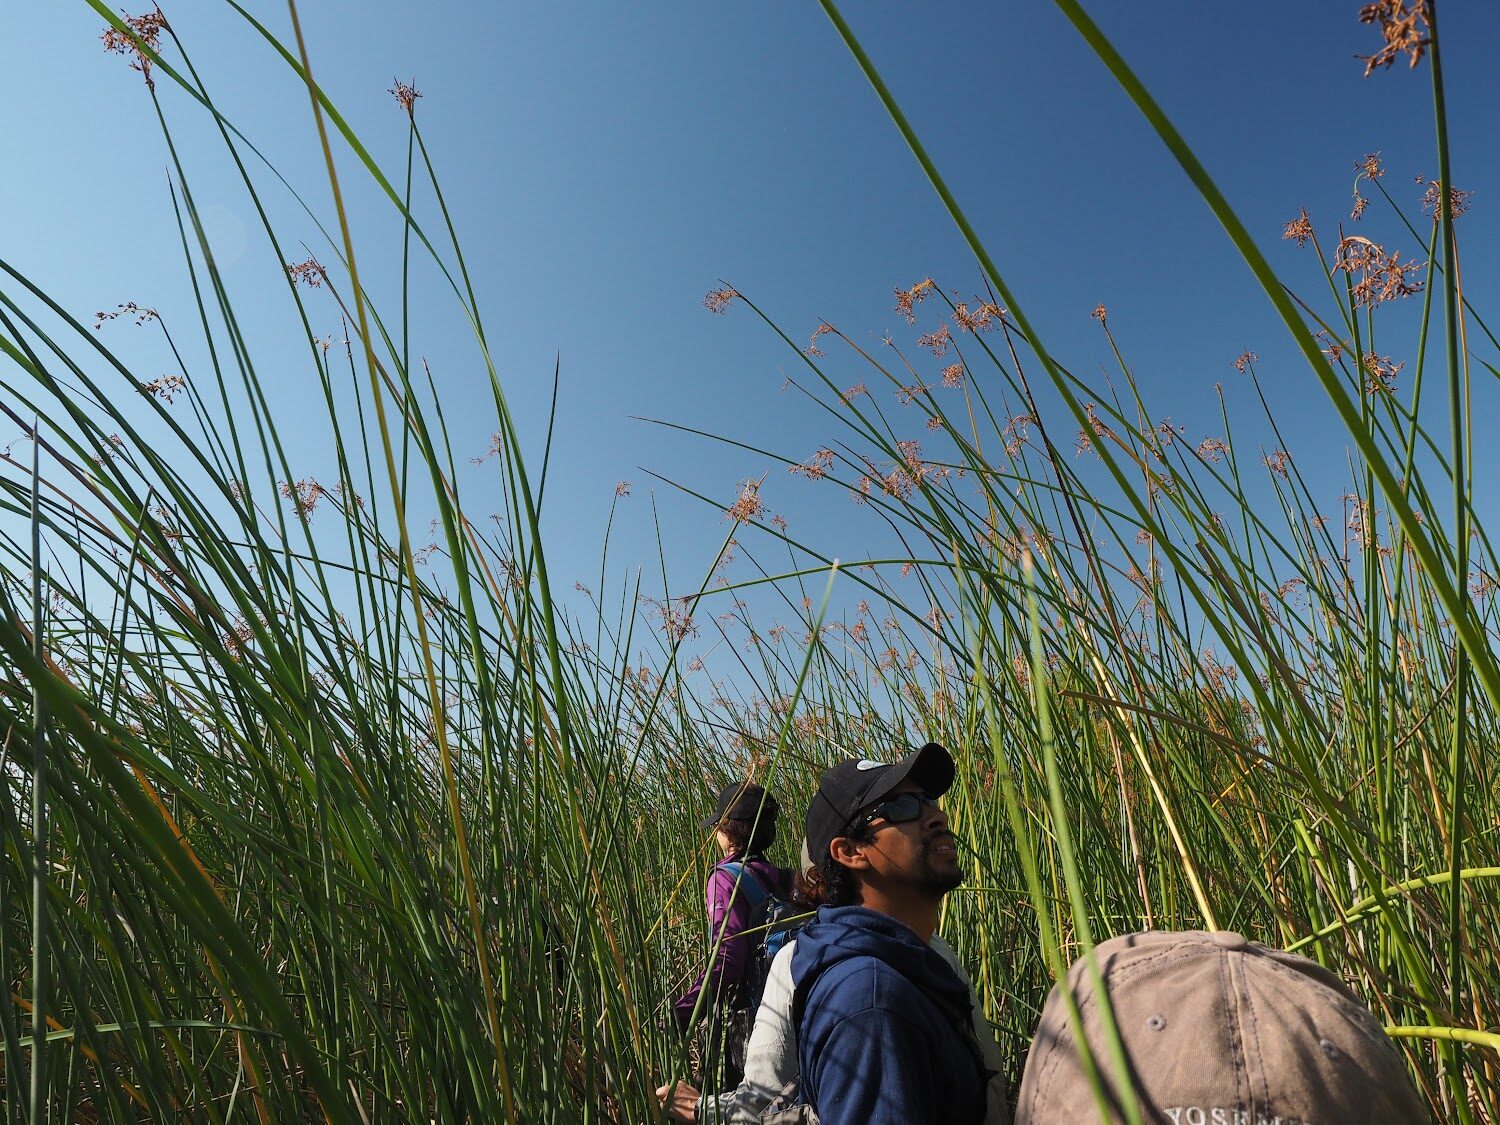
"After 21 years of conducting CRAM assessments, the marshes never fail to amaze me with their complexity and their beauty”. Quote and Photo by S. Pearce
Wetland Condition
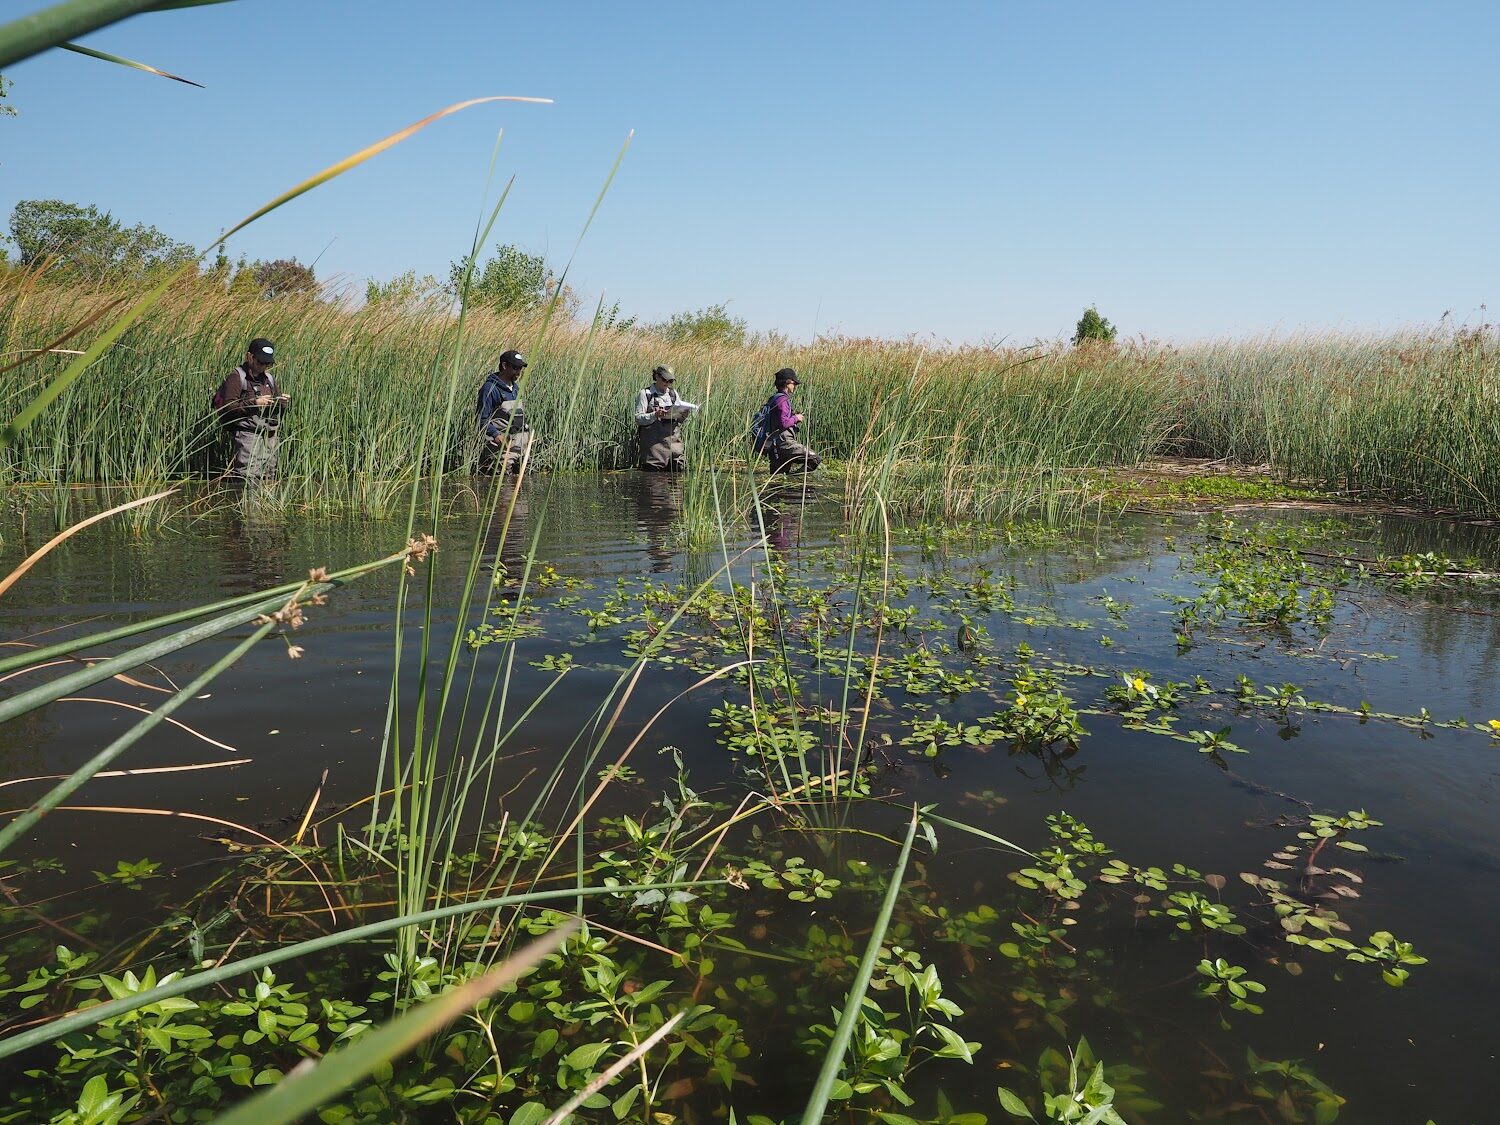
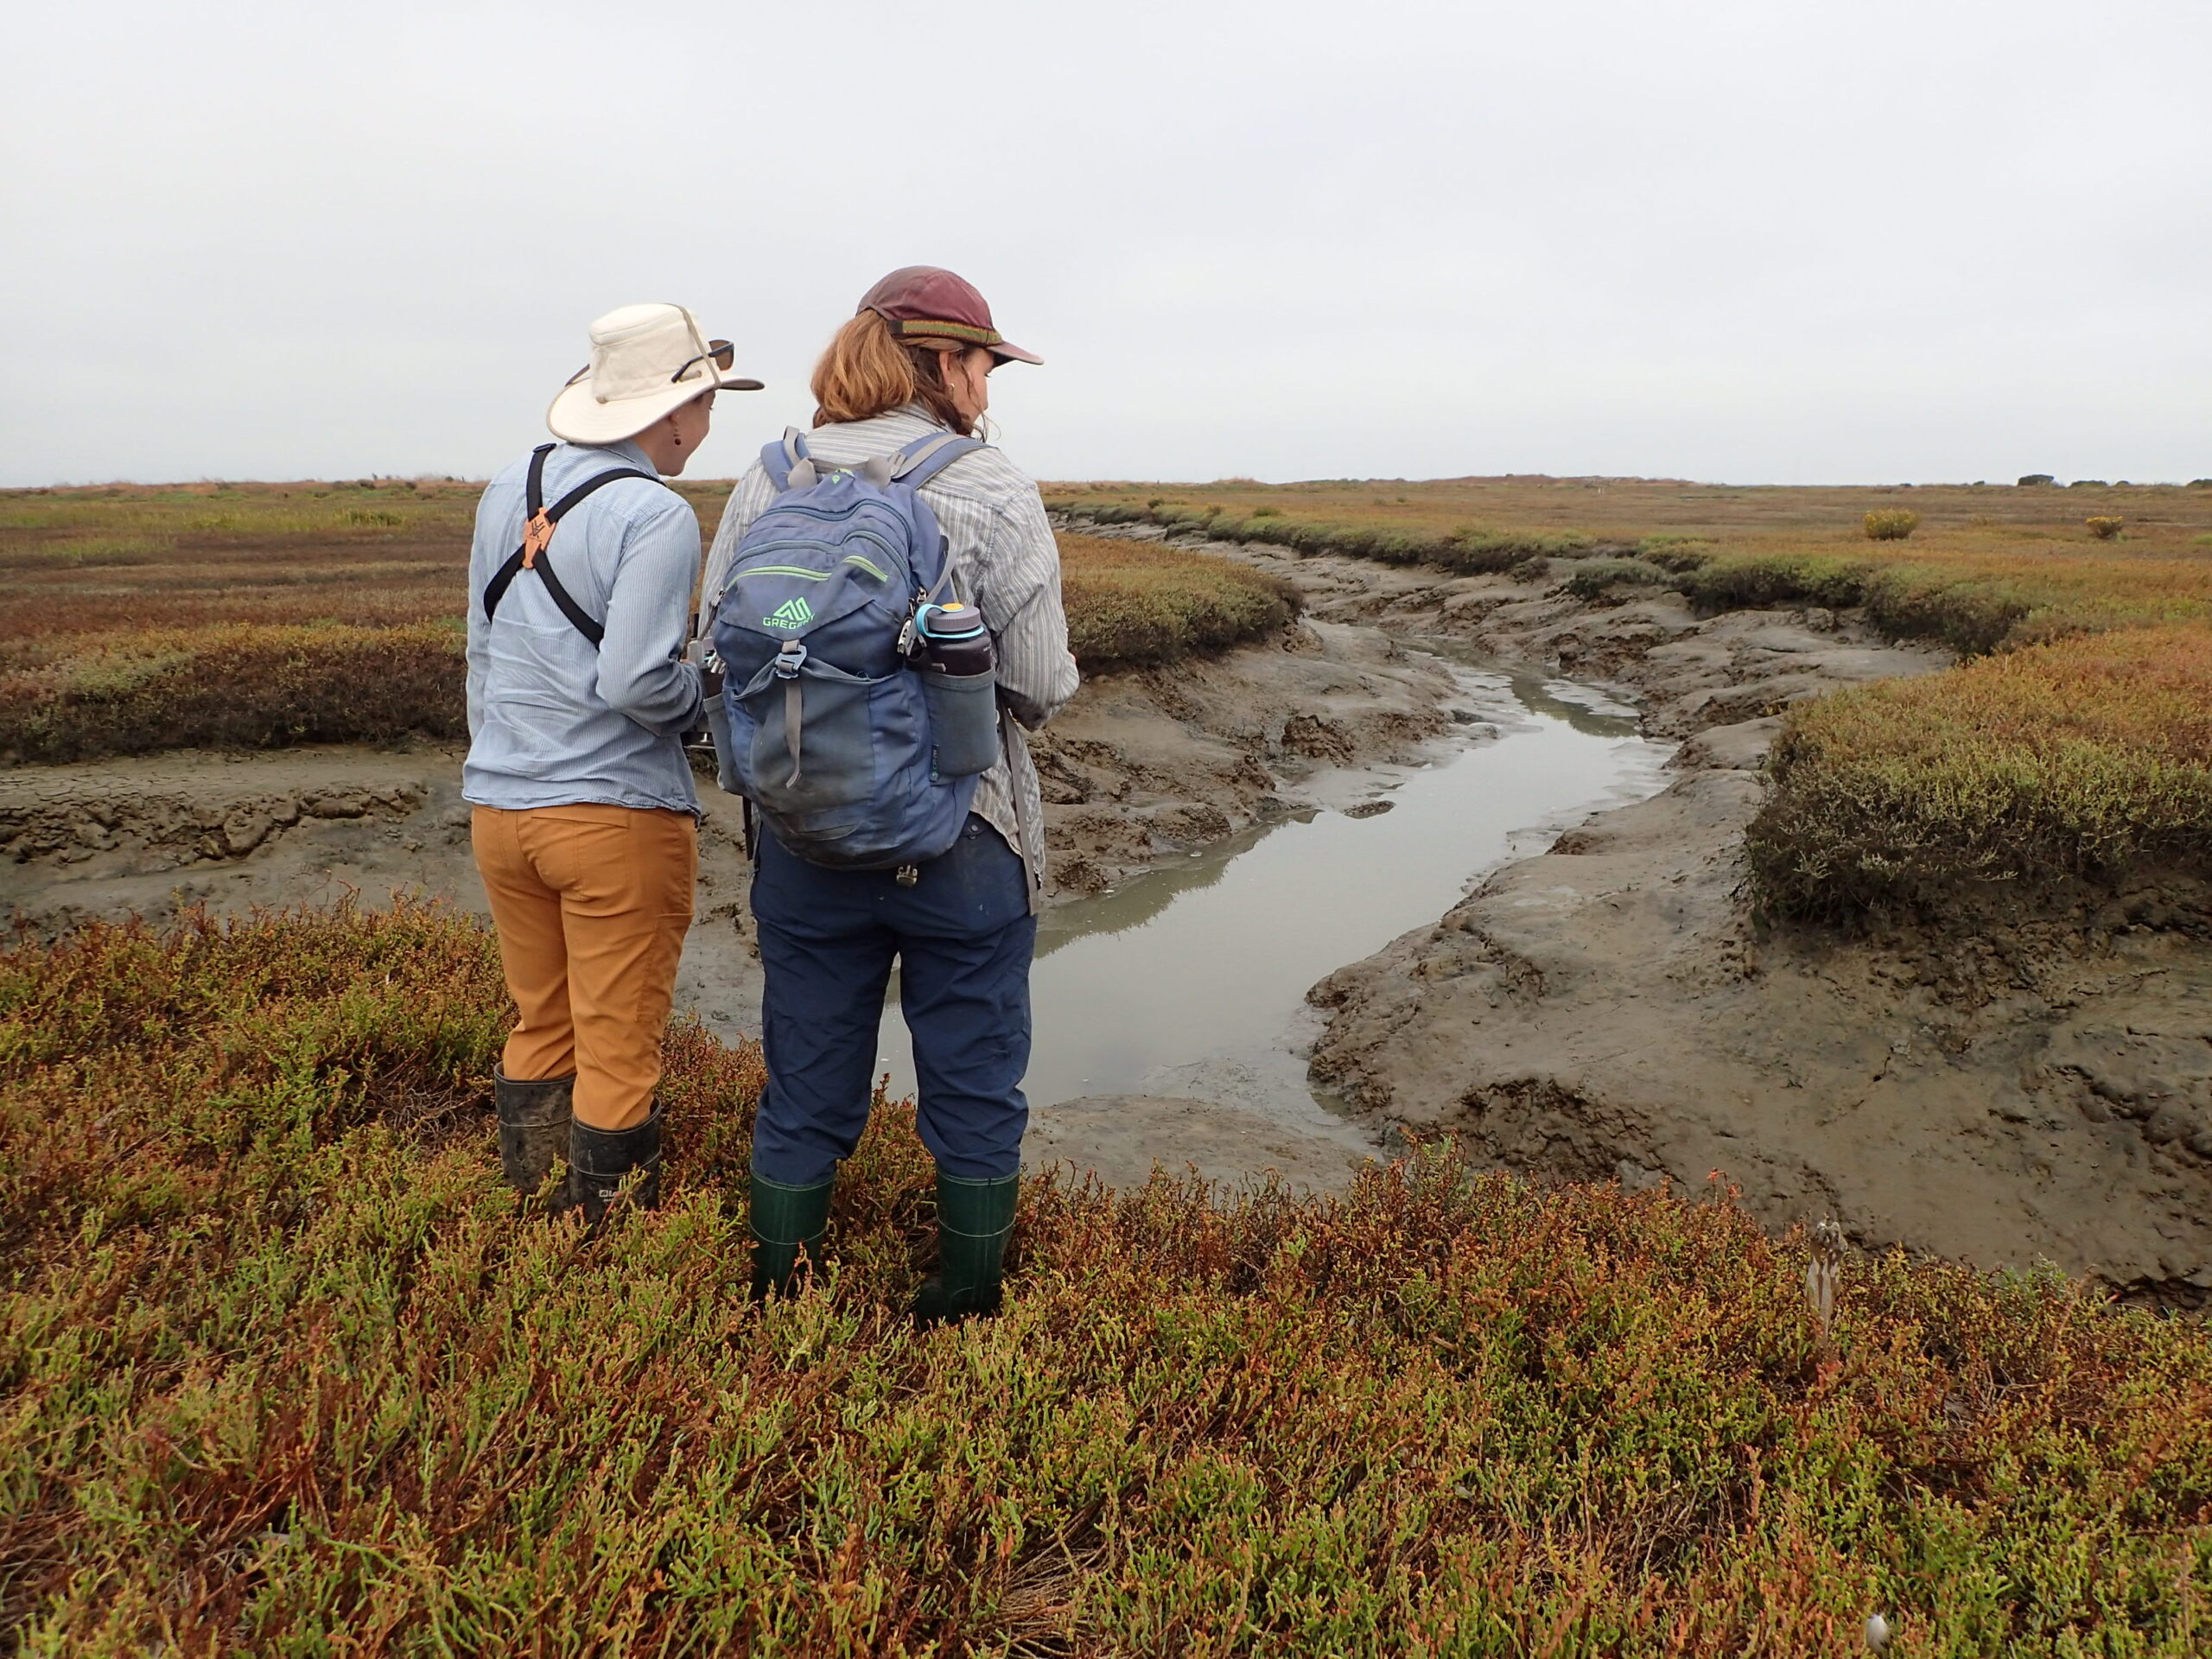
A typical CRAM field day
case study
CRAM fieldwork begins weeks in advance, ensuring access from land managers and planning the day around the tide schedule. On the field day, two CRAM-trained practitioners head out to the field with field manuals, datasheets, knee boots, camera, and plenty of water. The assessment location is chosen to be representative of the marsh, which can be far from the closest levee or road, so expert-level aerial photograph interpretation, with GPS, are used to navigate to the site. At the assessment area, the practitioners carefully walk the marsh, making observations about physical features (e.g., channels, pannes, logs, levees and transition zones), about the plant community (e.g., species, height classes, distribution patterns, density) and about the surrounding landscape. The practitioners answer several questions about all aspects of the marsh, with each resulting in a score representing the health (or condition) for that aspect. After observations and scoring are complete, the practitioners determine attribute-level and overall-level condition scores for the assessment area.