Monitoring Results
WRMP monitoring encompasses the “complete” tidal wetland ecosystem in San Francisco Bay, which includes shallow subtidal areas, tidal flats, fully tidal and muted tidal wetlands, and adjoining upland and riverine transition zones.
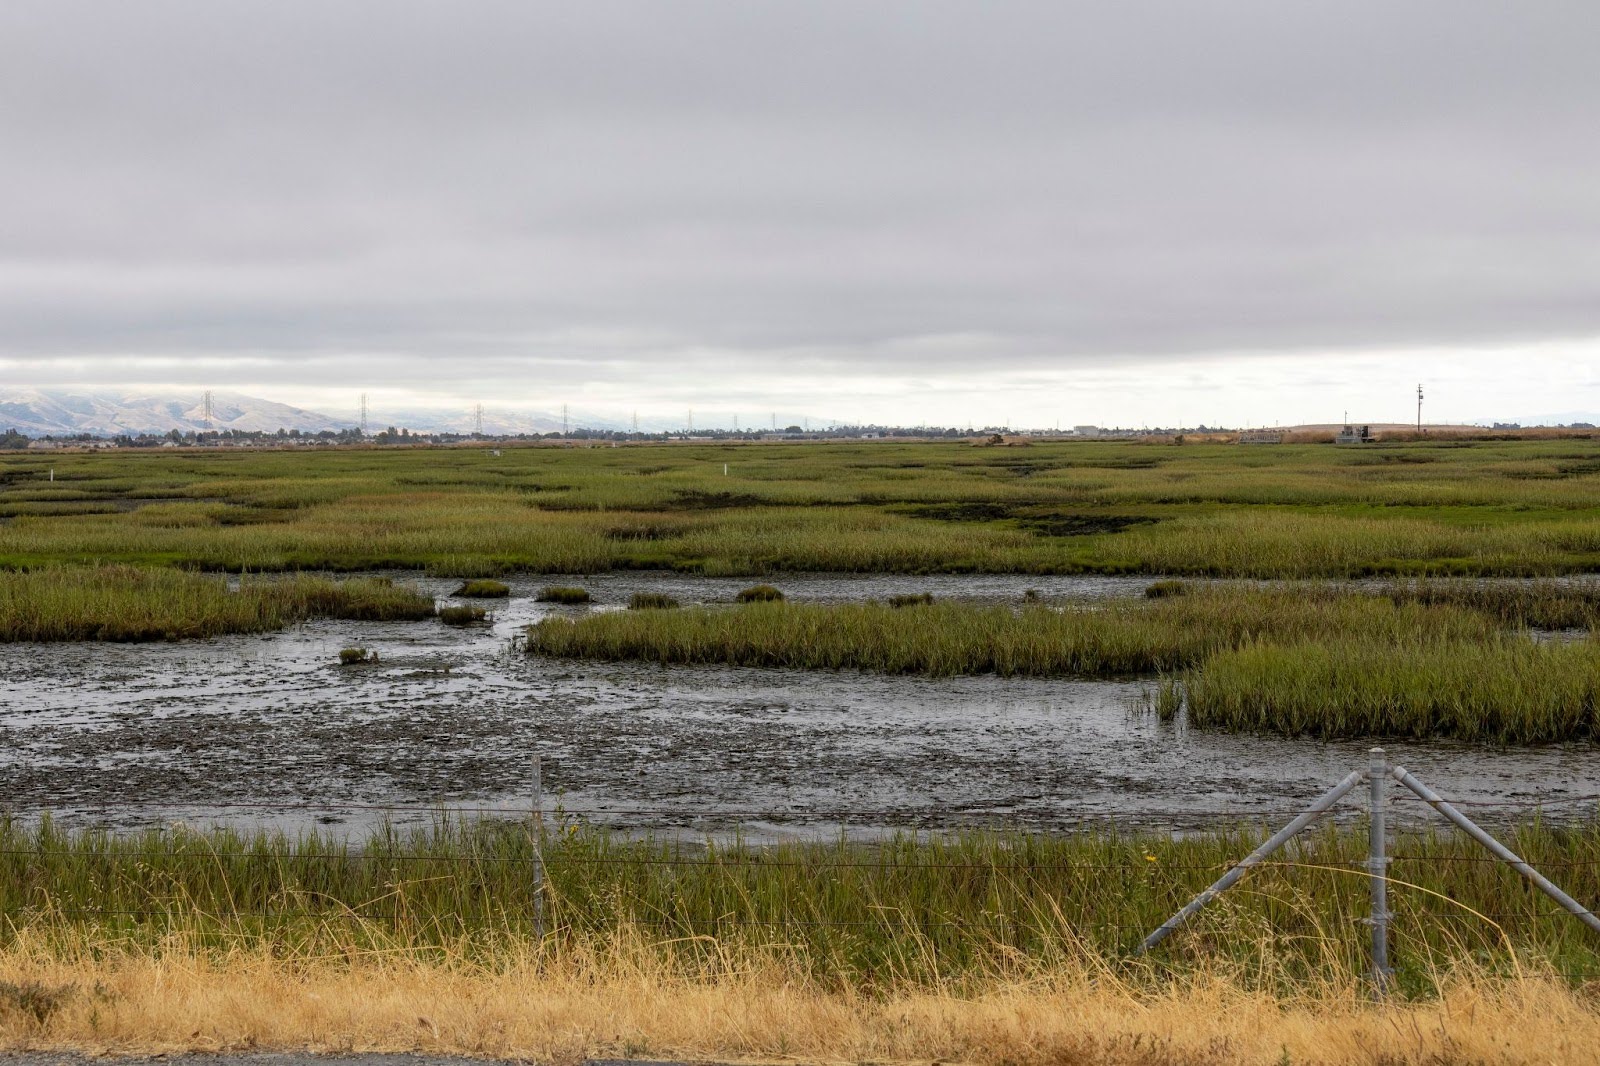
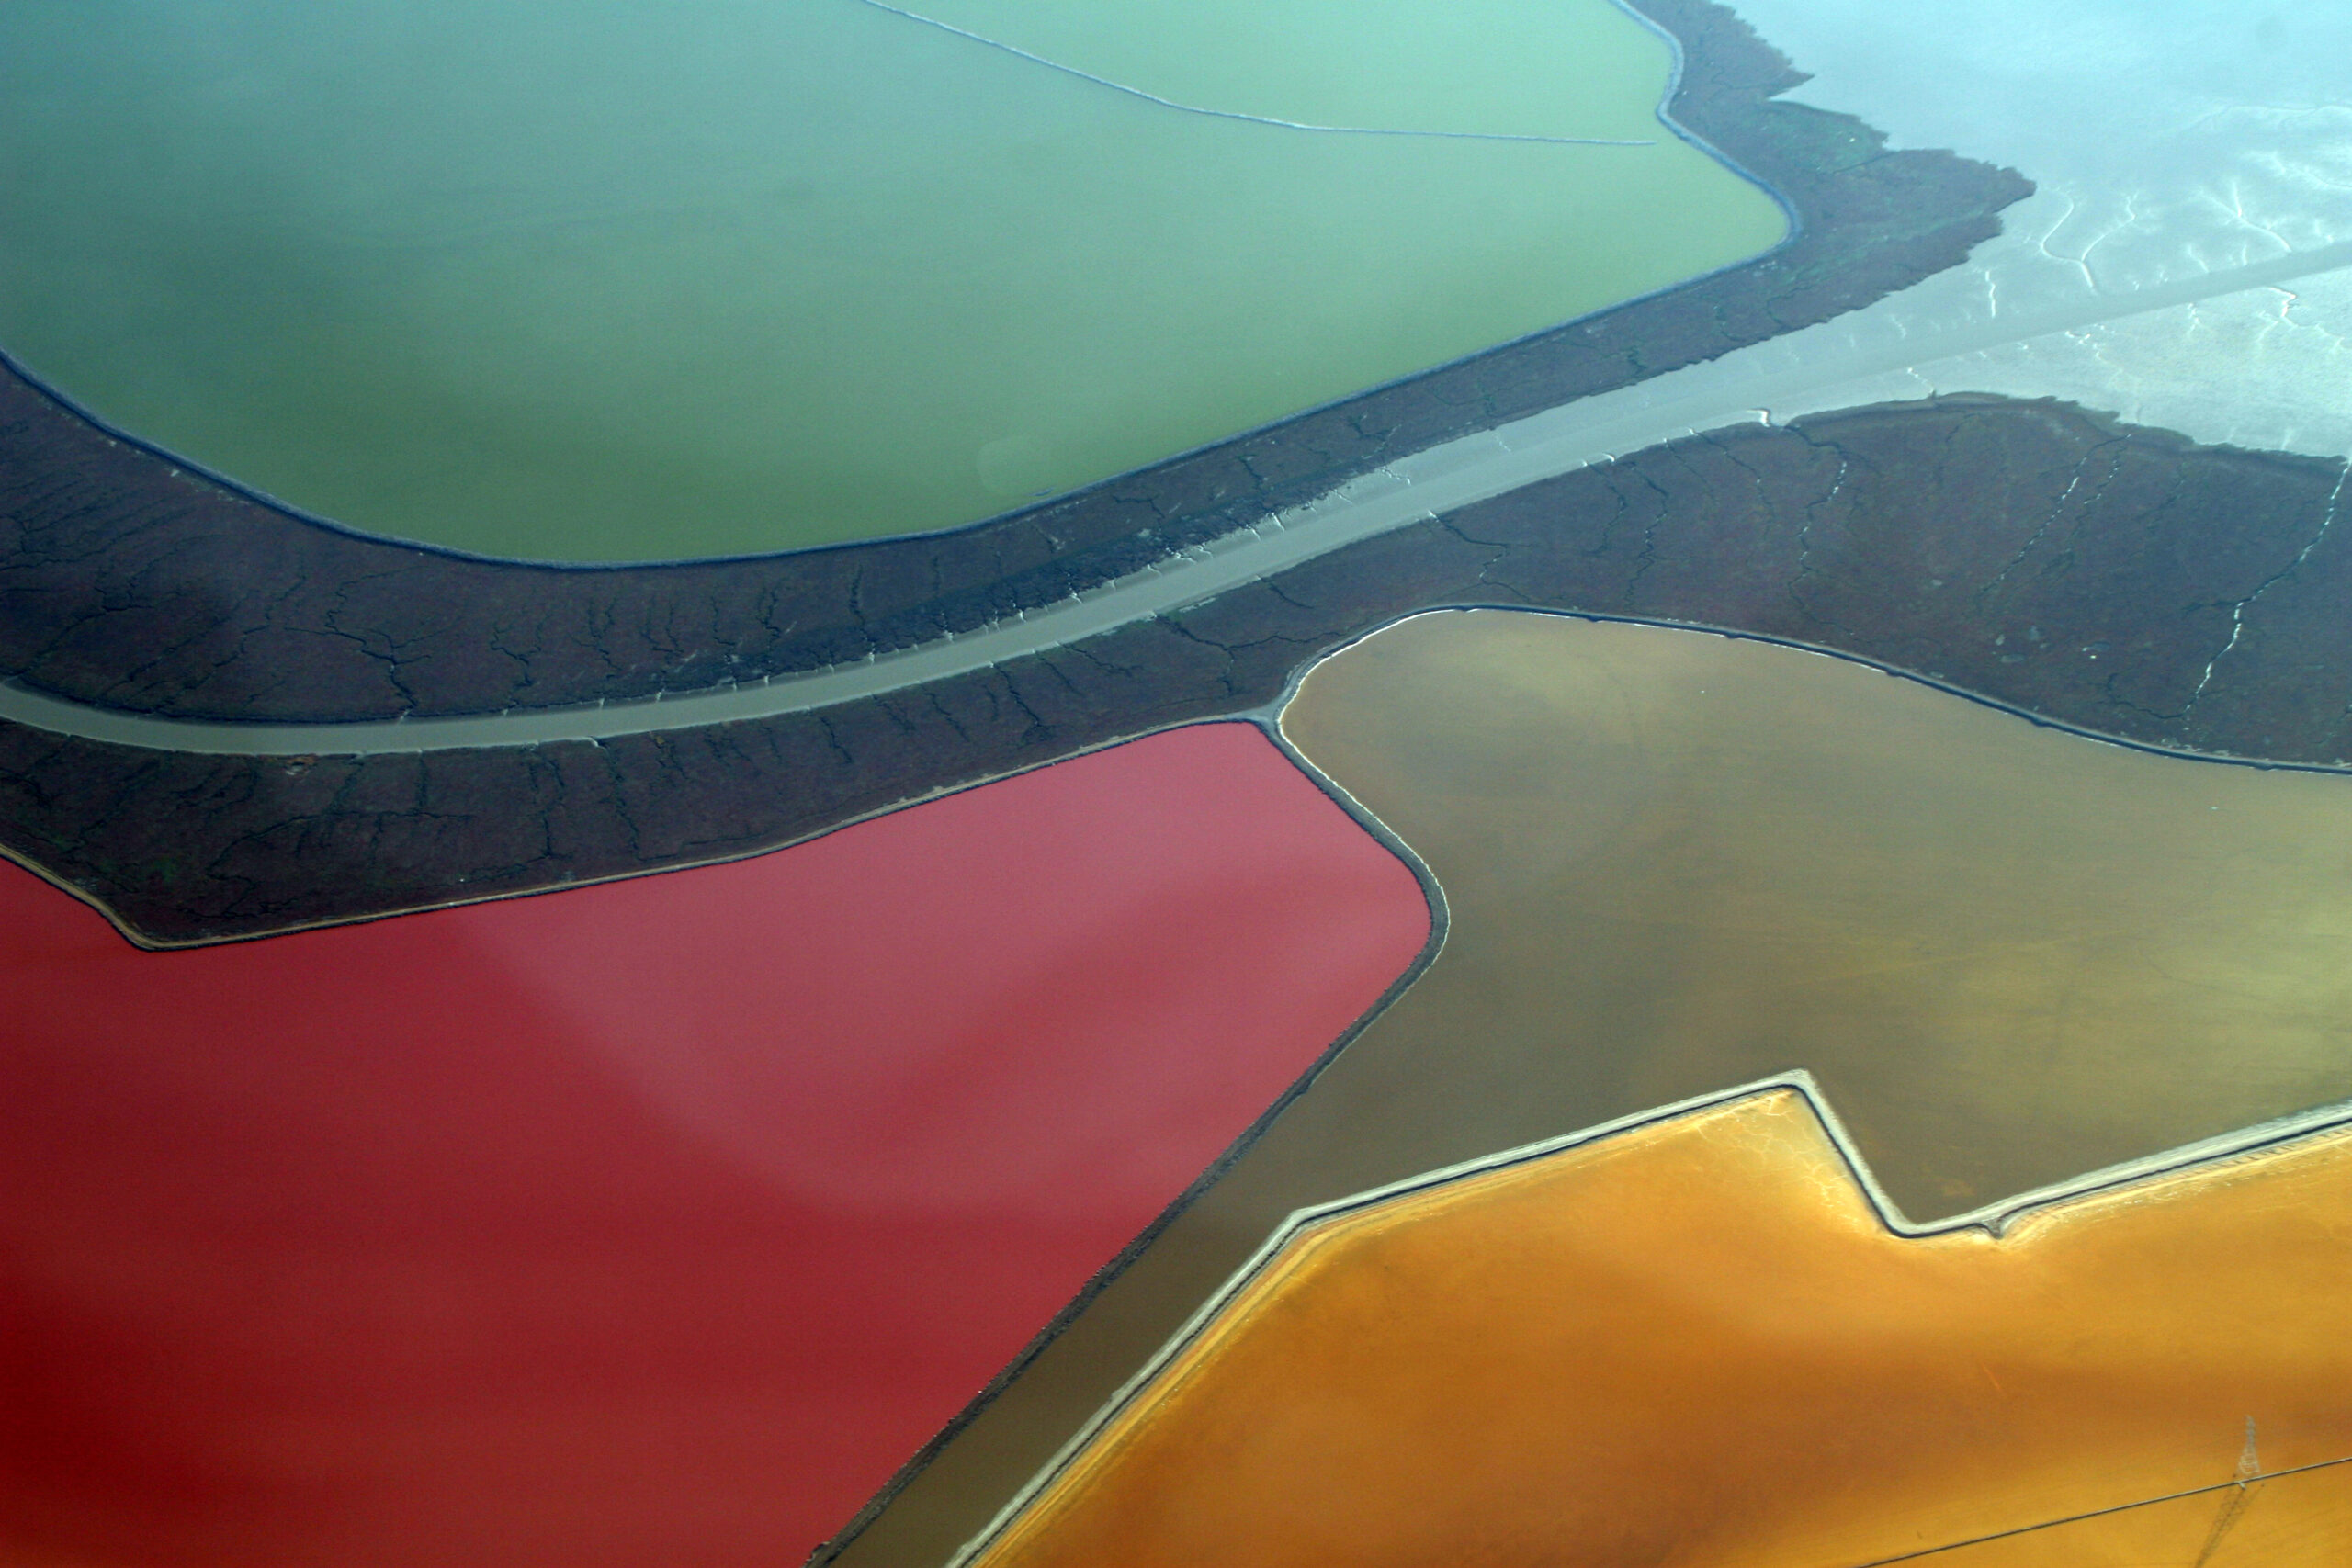
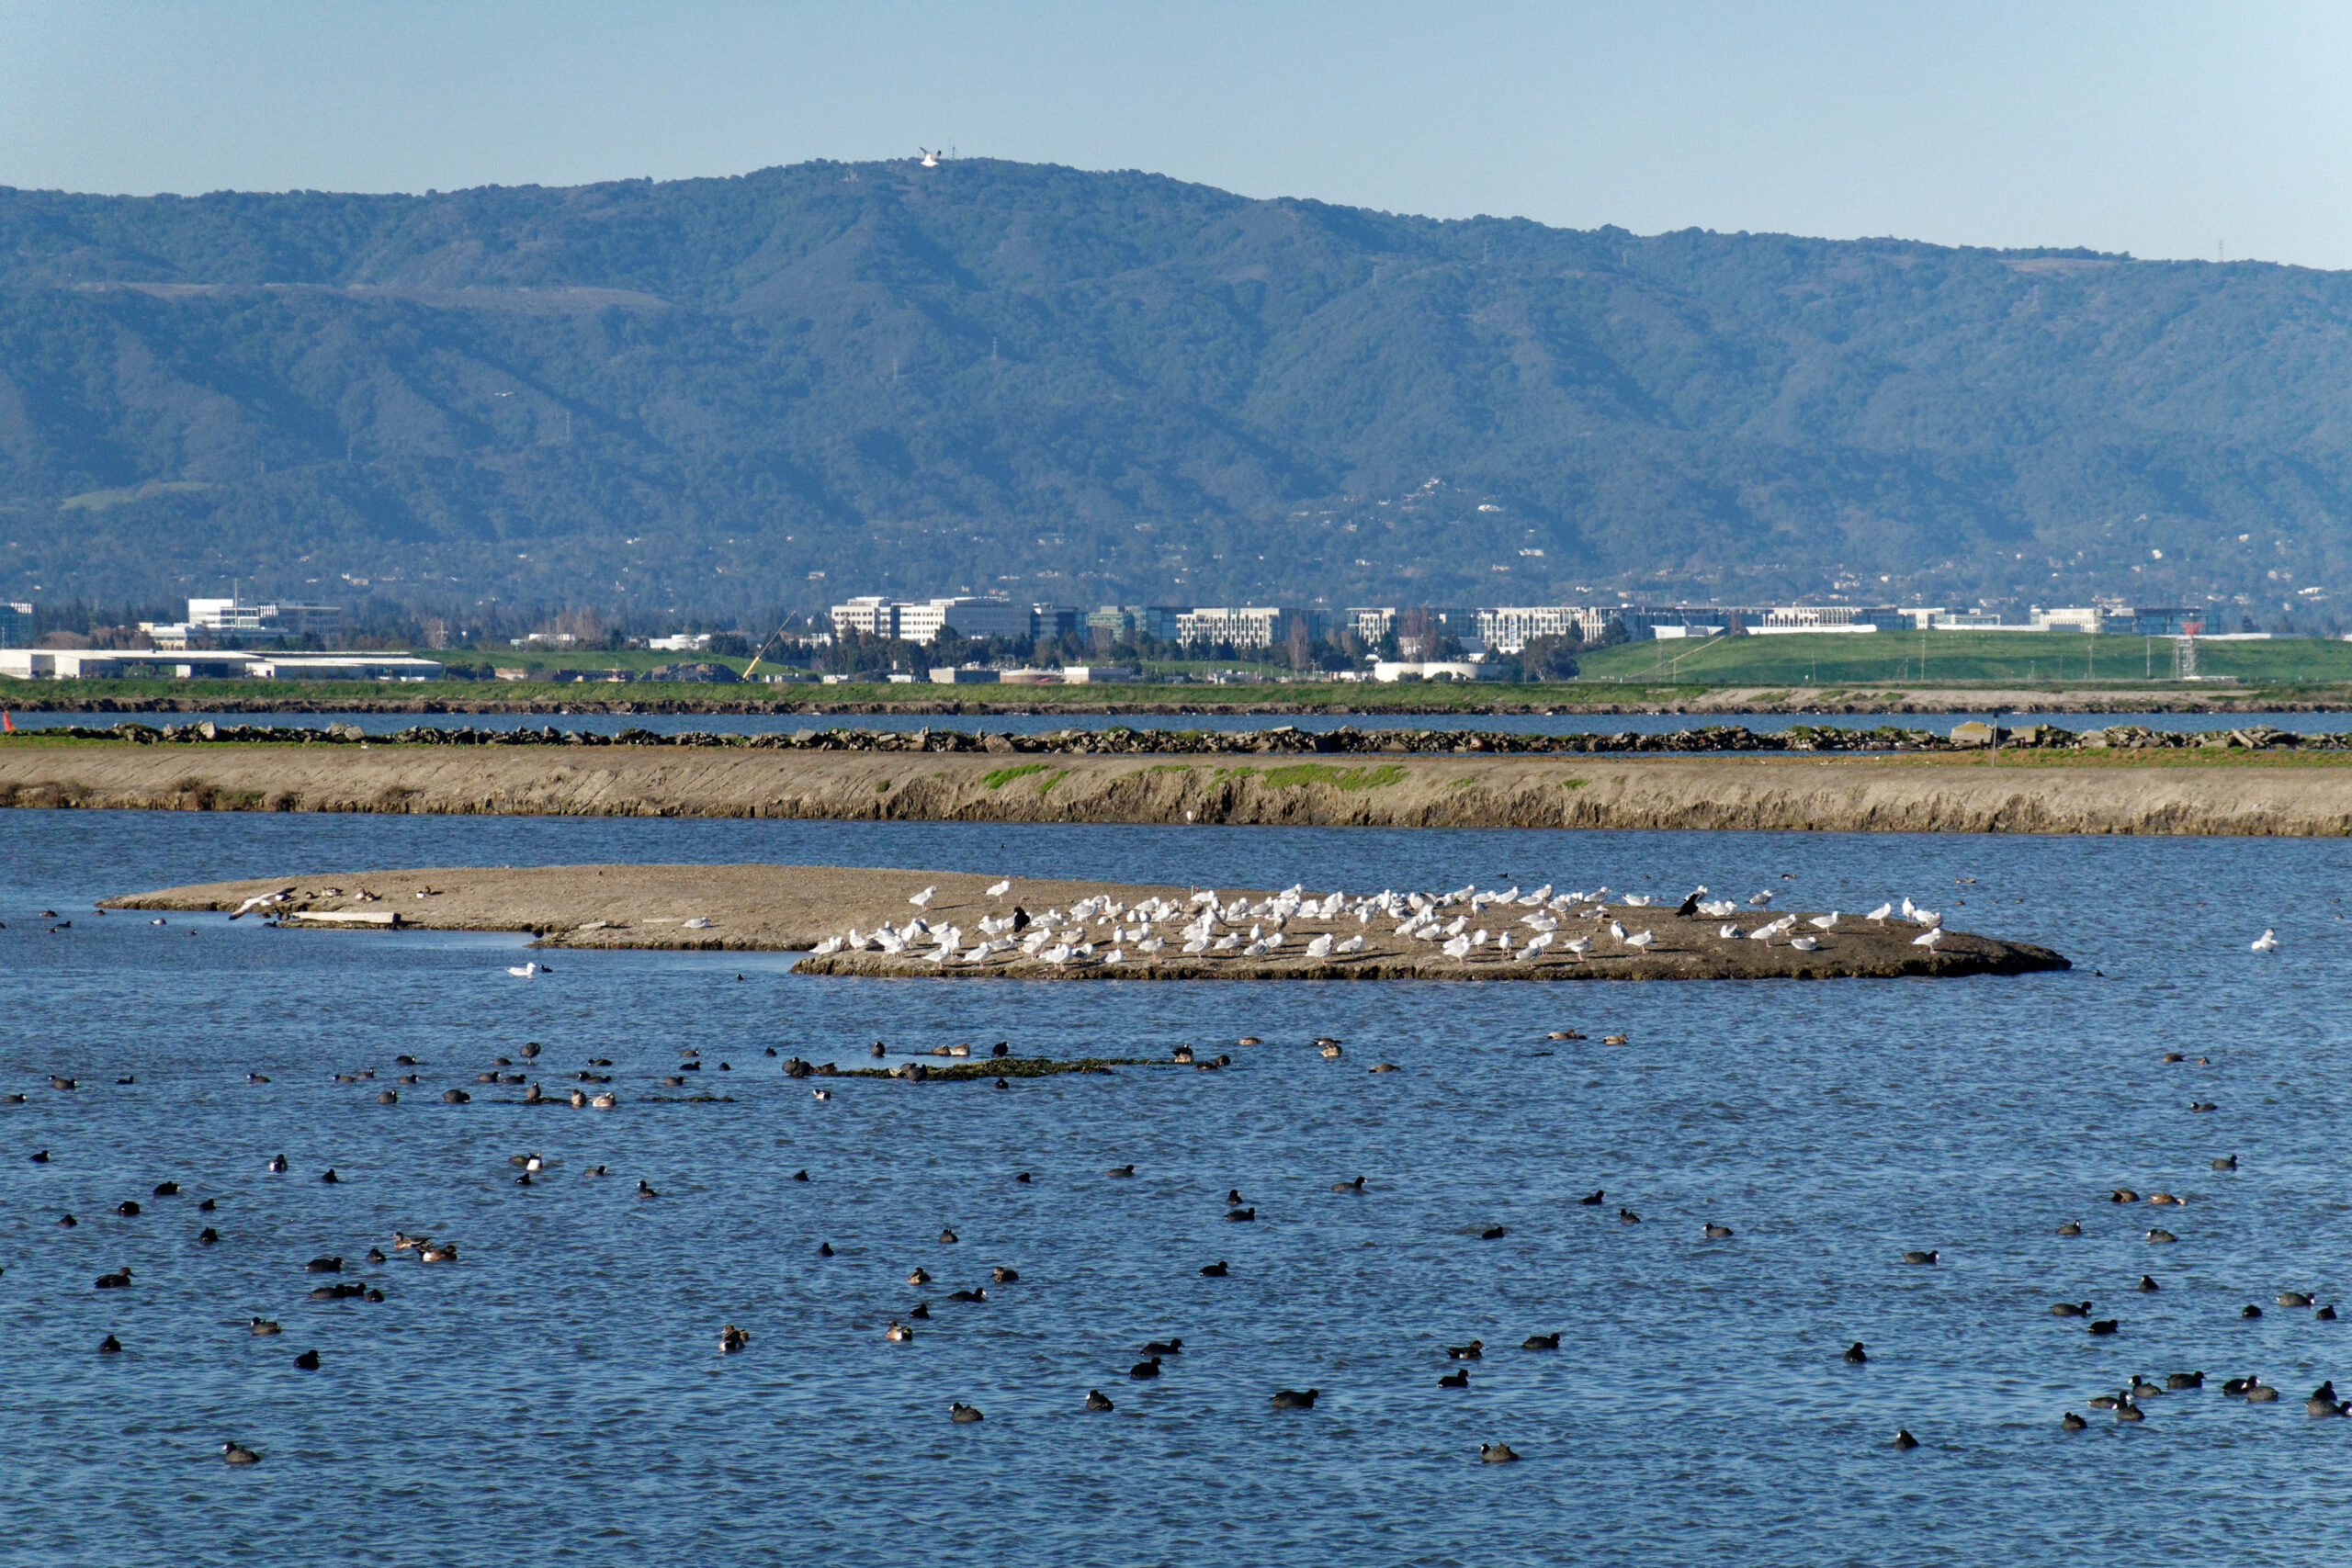
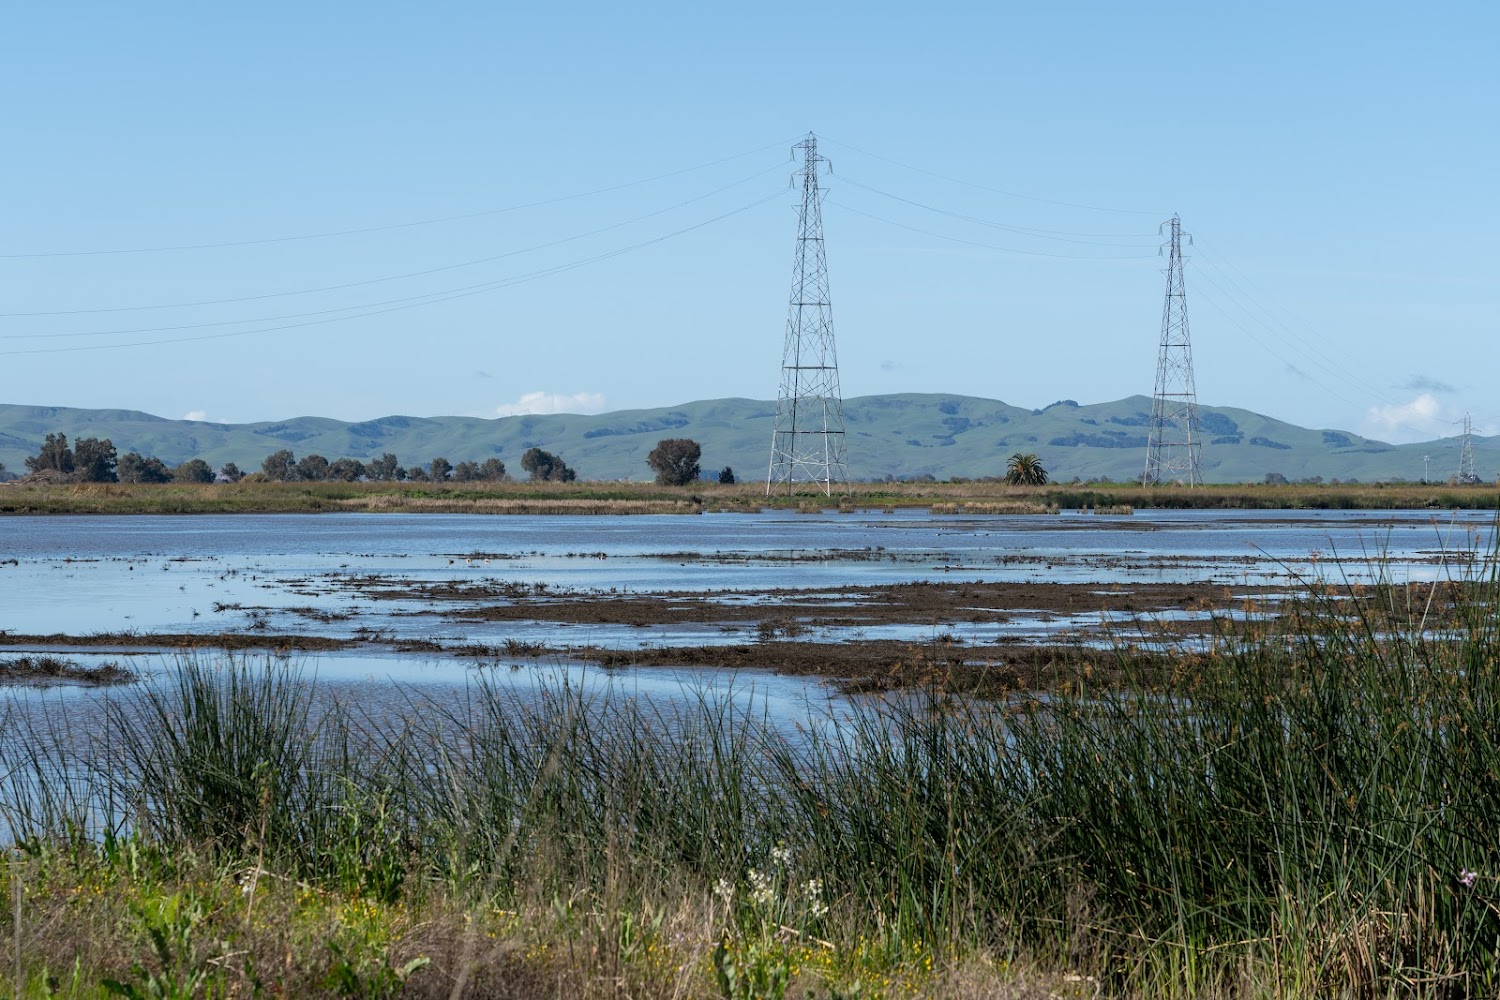
San Francisco Bay’s tidal waters are influenced by both the ocean and freshwater riverine sources. The intertidal areas between the highest and lowest tides define the bayland extent. Common tidal bayland habitats include tidal wetlands, flats (mudflats) and channels. Vegetated tidal wetlands vary in salinity from fresh to saline and exist along the shoreline of the Bay and along tidal reaches of adjoining rivers and streams. Tidal flats and channels, which can be exposed at low tides, serve as crucial habitat for bird and fish species. The upland edge of tidal wetlands are key for wetland migration as water levels rise. All bayland habitats should be managed using a holistic approach, which the WRMP is taking.
Challenge & Response
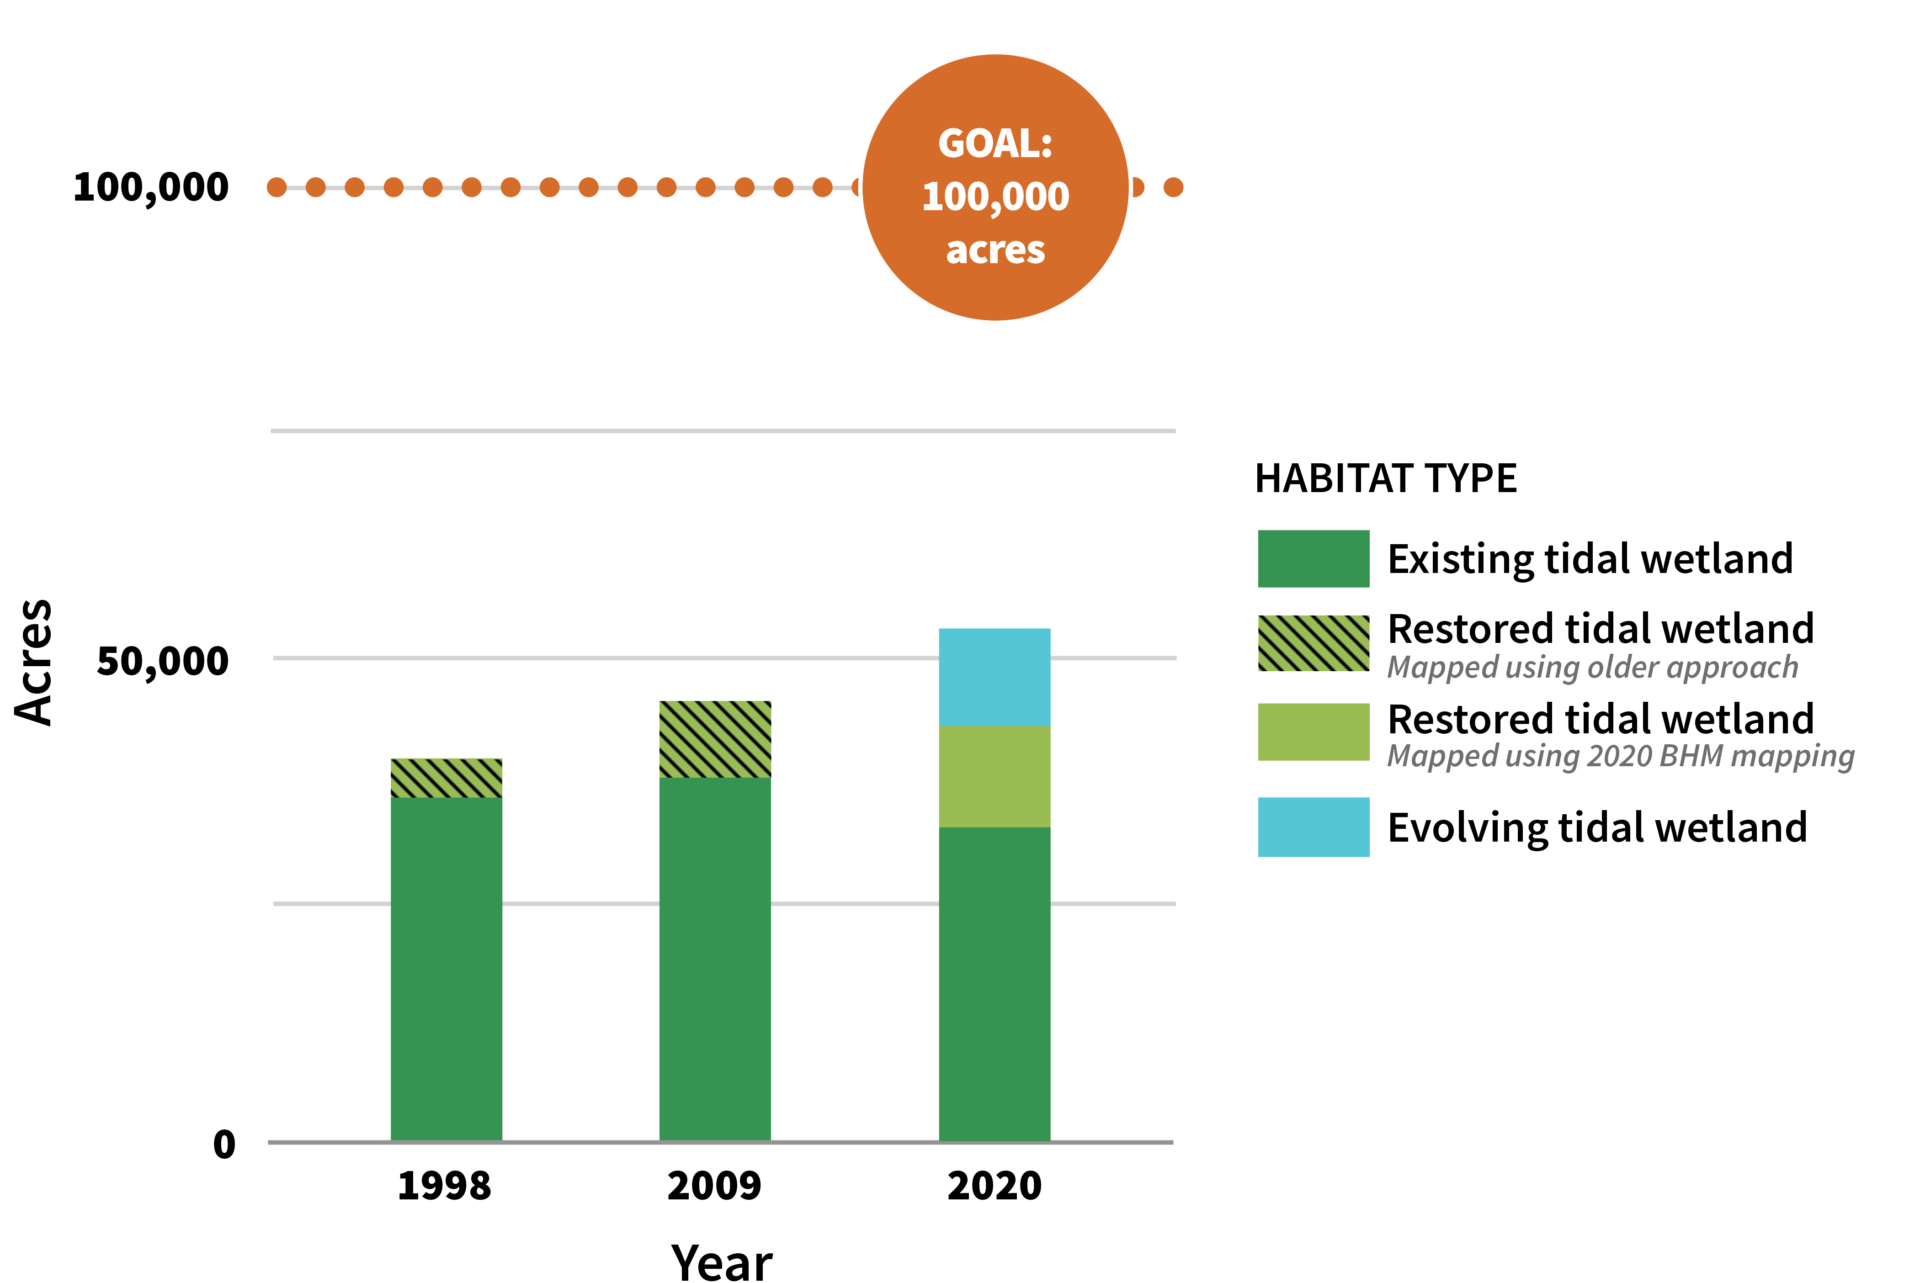
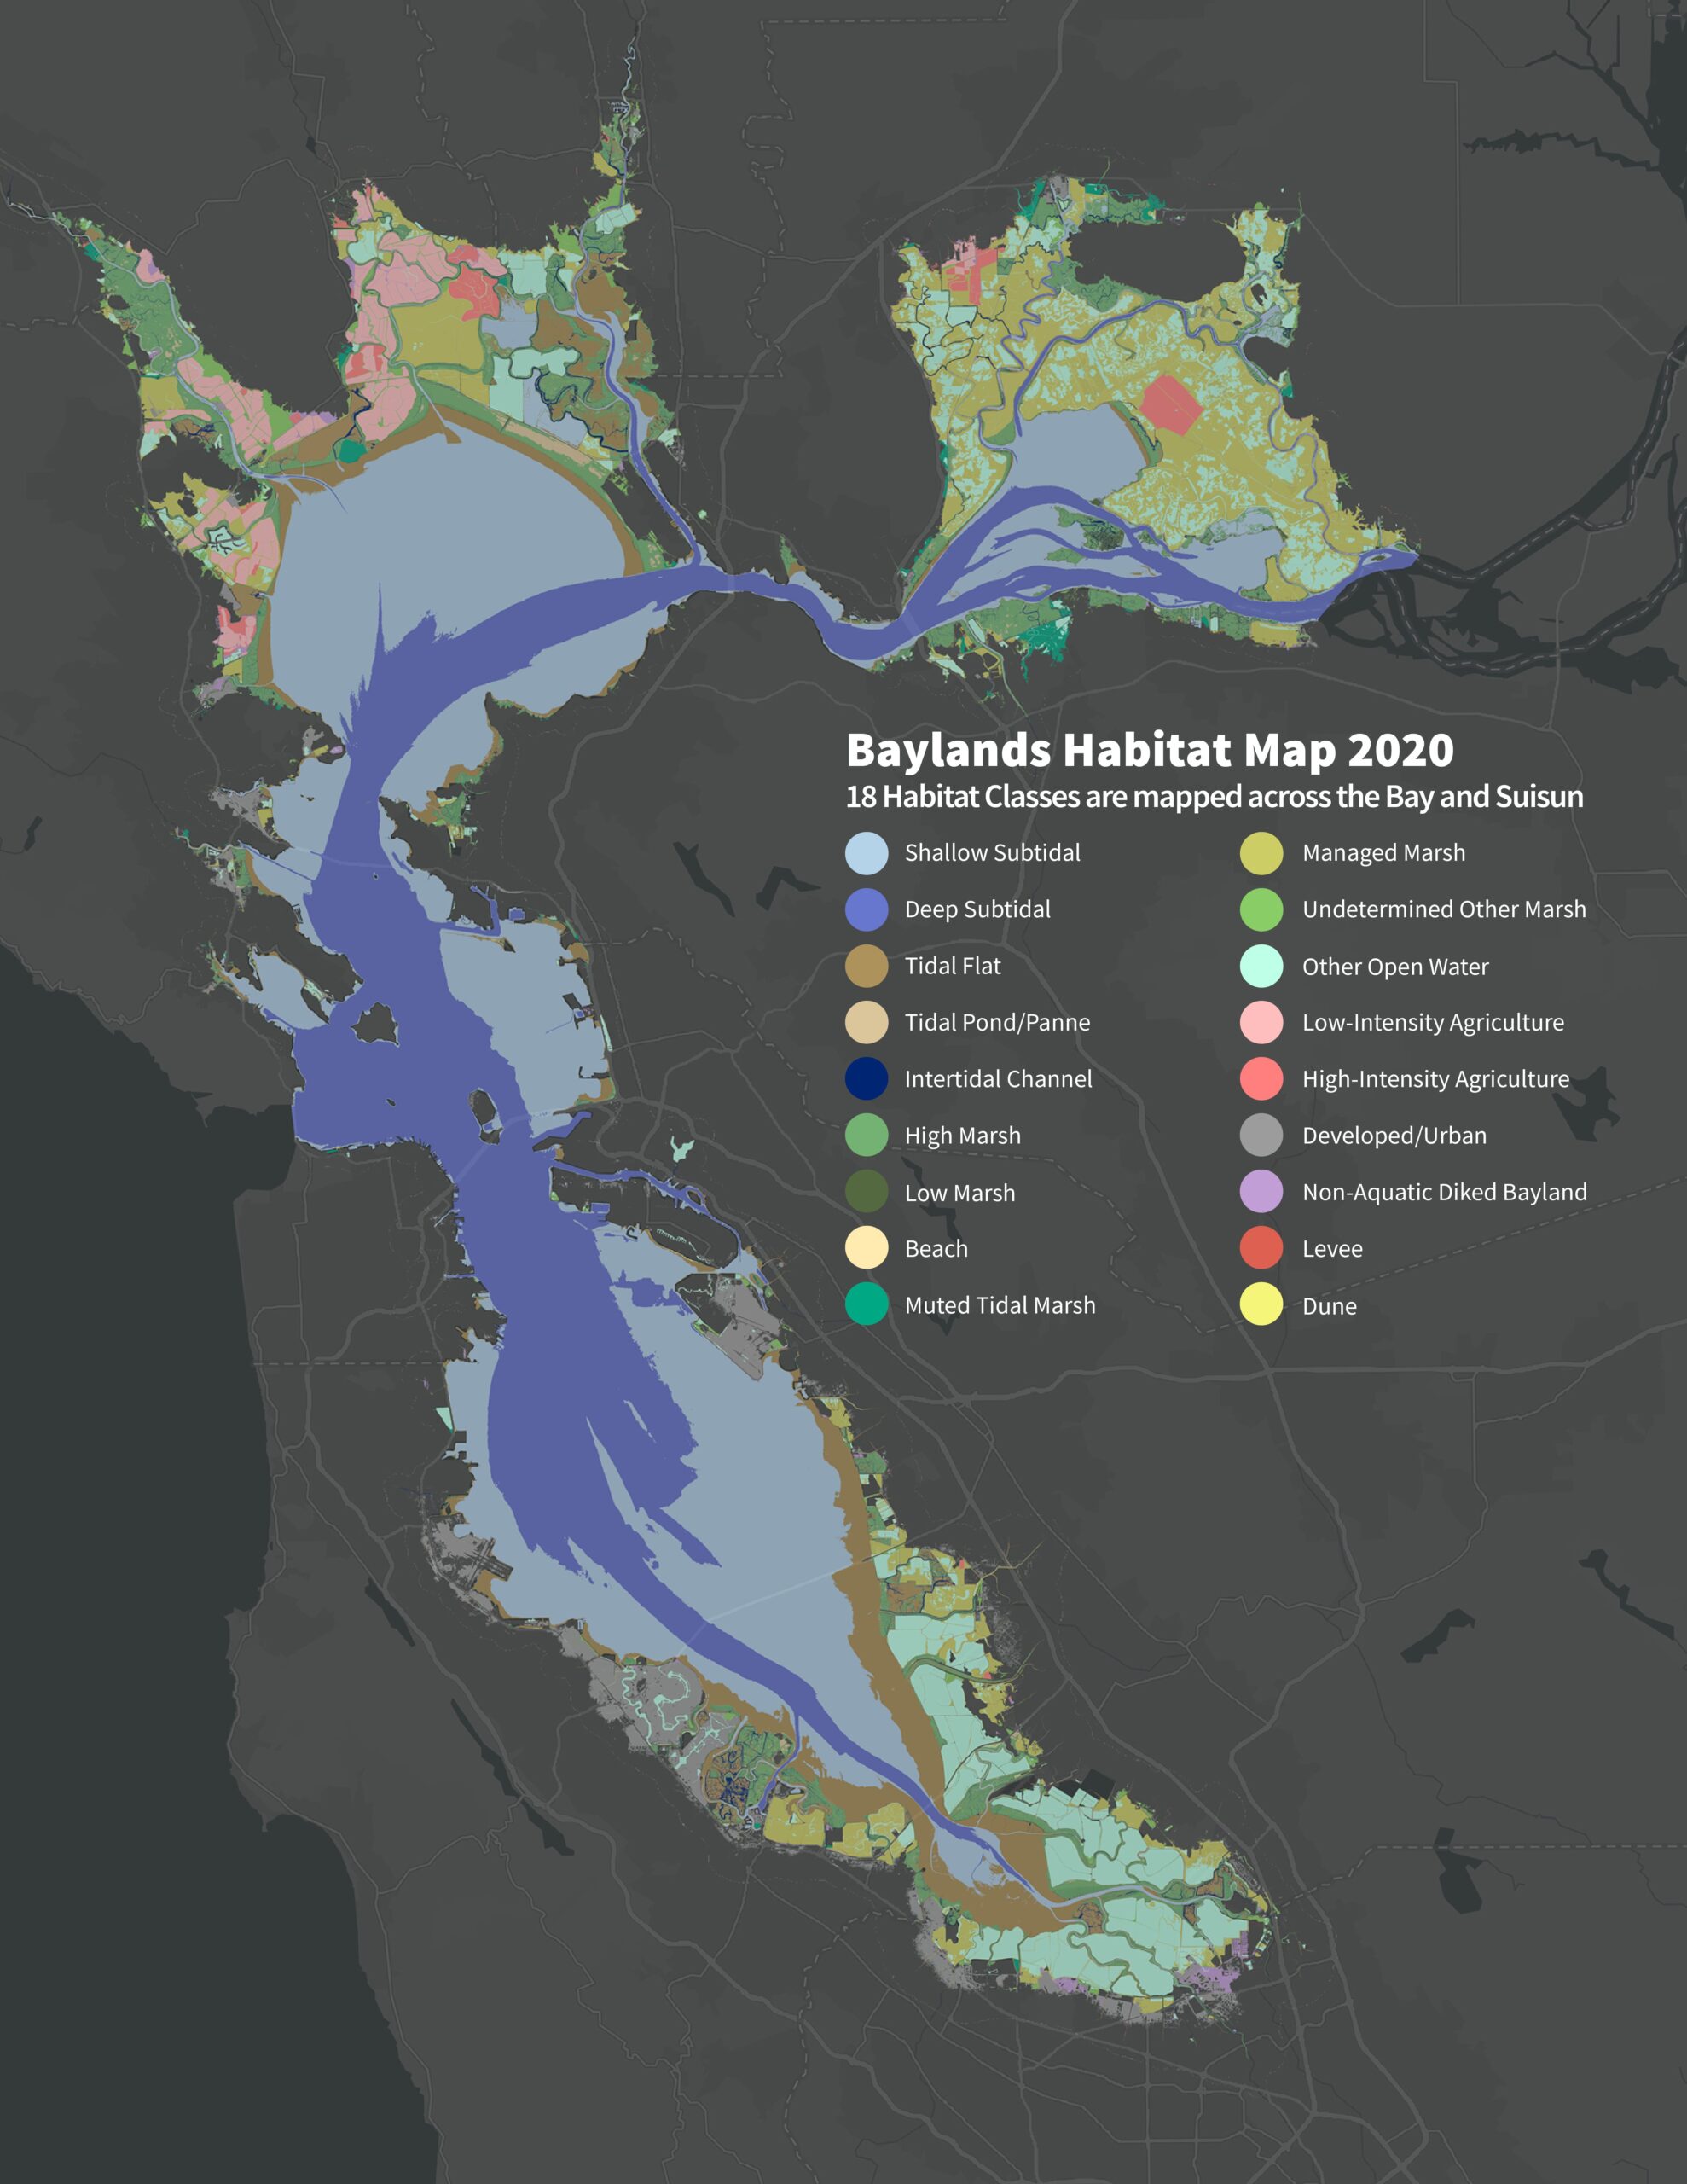
The Estuary originally supported nearly 190,000 acres of tidal marshes. Between the mid 1800s and 1990s, about 80 percent of the Estuary’s tidal marshes were diked and filled. Starting in the late 1980s, wetland protection and restoration activities reversed the loss of wetland habitat. Although barriers exist for completely restoring the region’s historical tidal marshes, there are many locations available for restoration. The current tidal marsh conservation and restoration target is to reach 100,000 acres in the Estuary. Part of reaching that goal is tracking how many acres there are and how that is changing over time. The 1999 Goals Project provided the first comprehensive measurement of baylands habitat extent in 1998, followed by the Bay Area Aquatic Resource Inventory (BAARI) in 2009. The WRMP developed the Baylands Habitat Map (BHM) 2020, which uses cutting-edge automated mapping techniques for a consistent, repeatable way to map wetland extent and change in the region.
Monitoring the extent and distribution of wetlands in the Estuary is an important component of the WRMP Science Framework because it tracks the effects of wetland restoration.
Key Metrics & Figures
WRMP metrics track how wetland restoration projects are increasing the acres and breadth of habitat types in the Estuary. This includes mapping the bayland habitats (tidal marsh, channels, mudflats, ponds/pannes, etc.), and tracking changes over time.
Metrics describe how the WRMP conducts science to better understand and monitor the Estuary’s tidal wetlands, like water quality, fish habitat, wetland condition, and benefits to humans. Explore all the WRMP’s metrics, which aim to guide wetland management and restoration.
How We Monitor
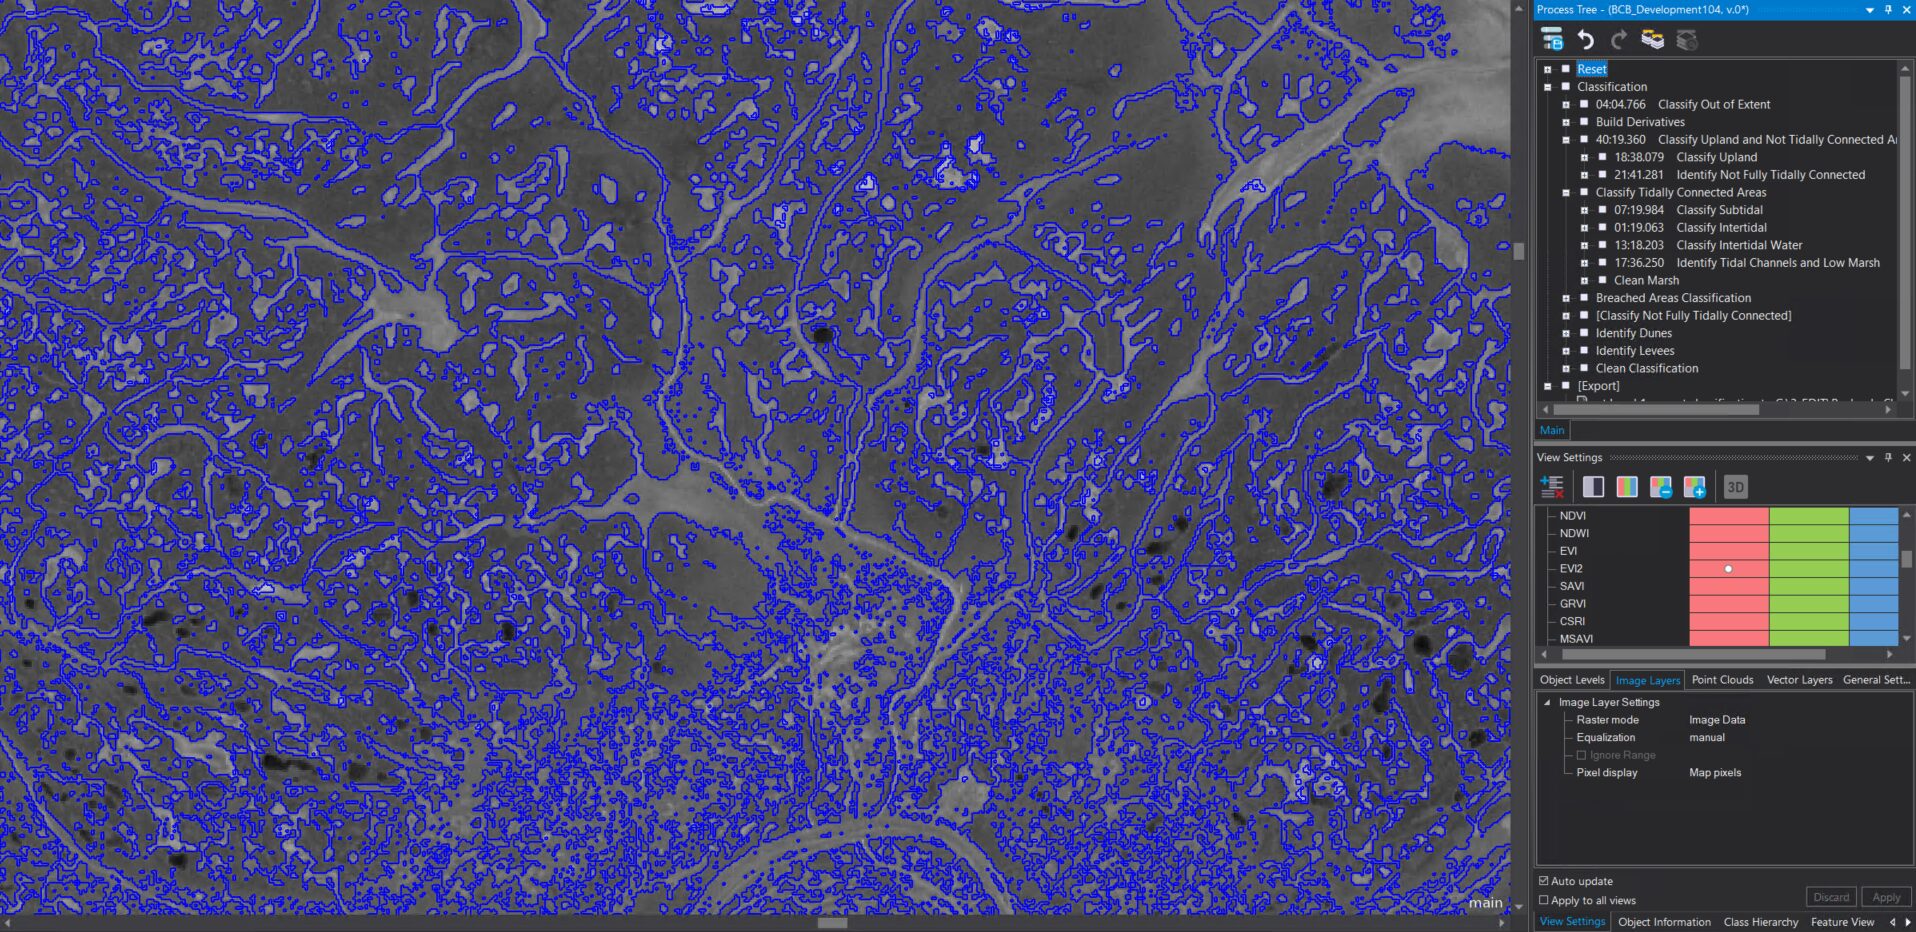
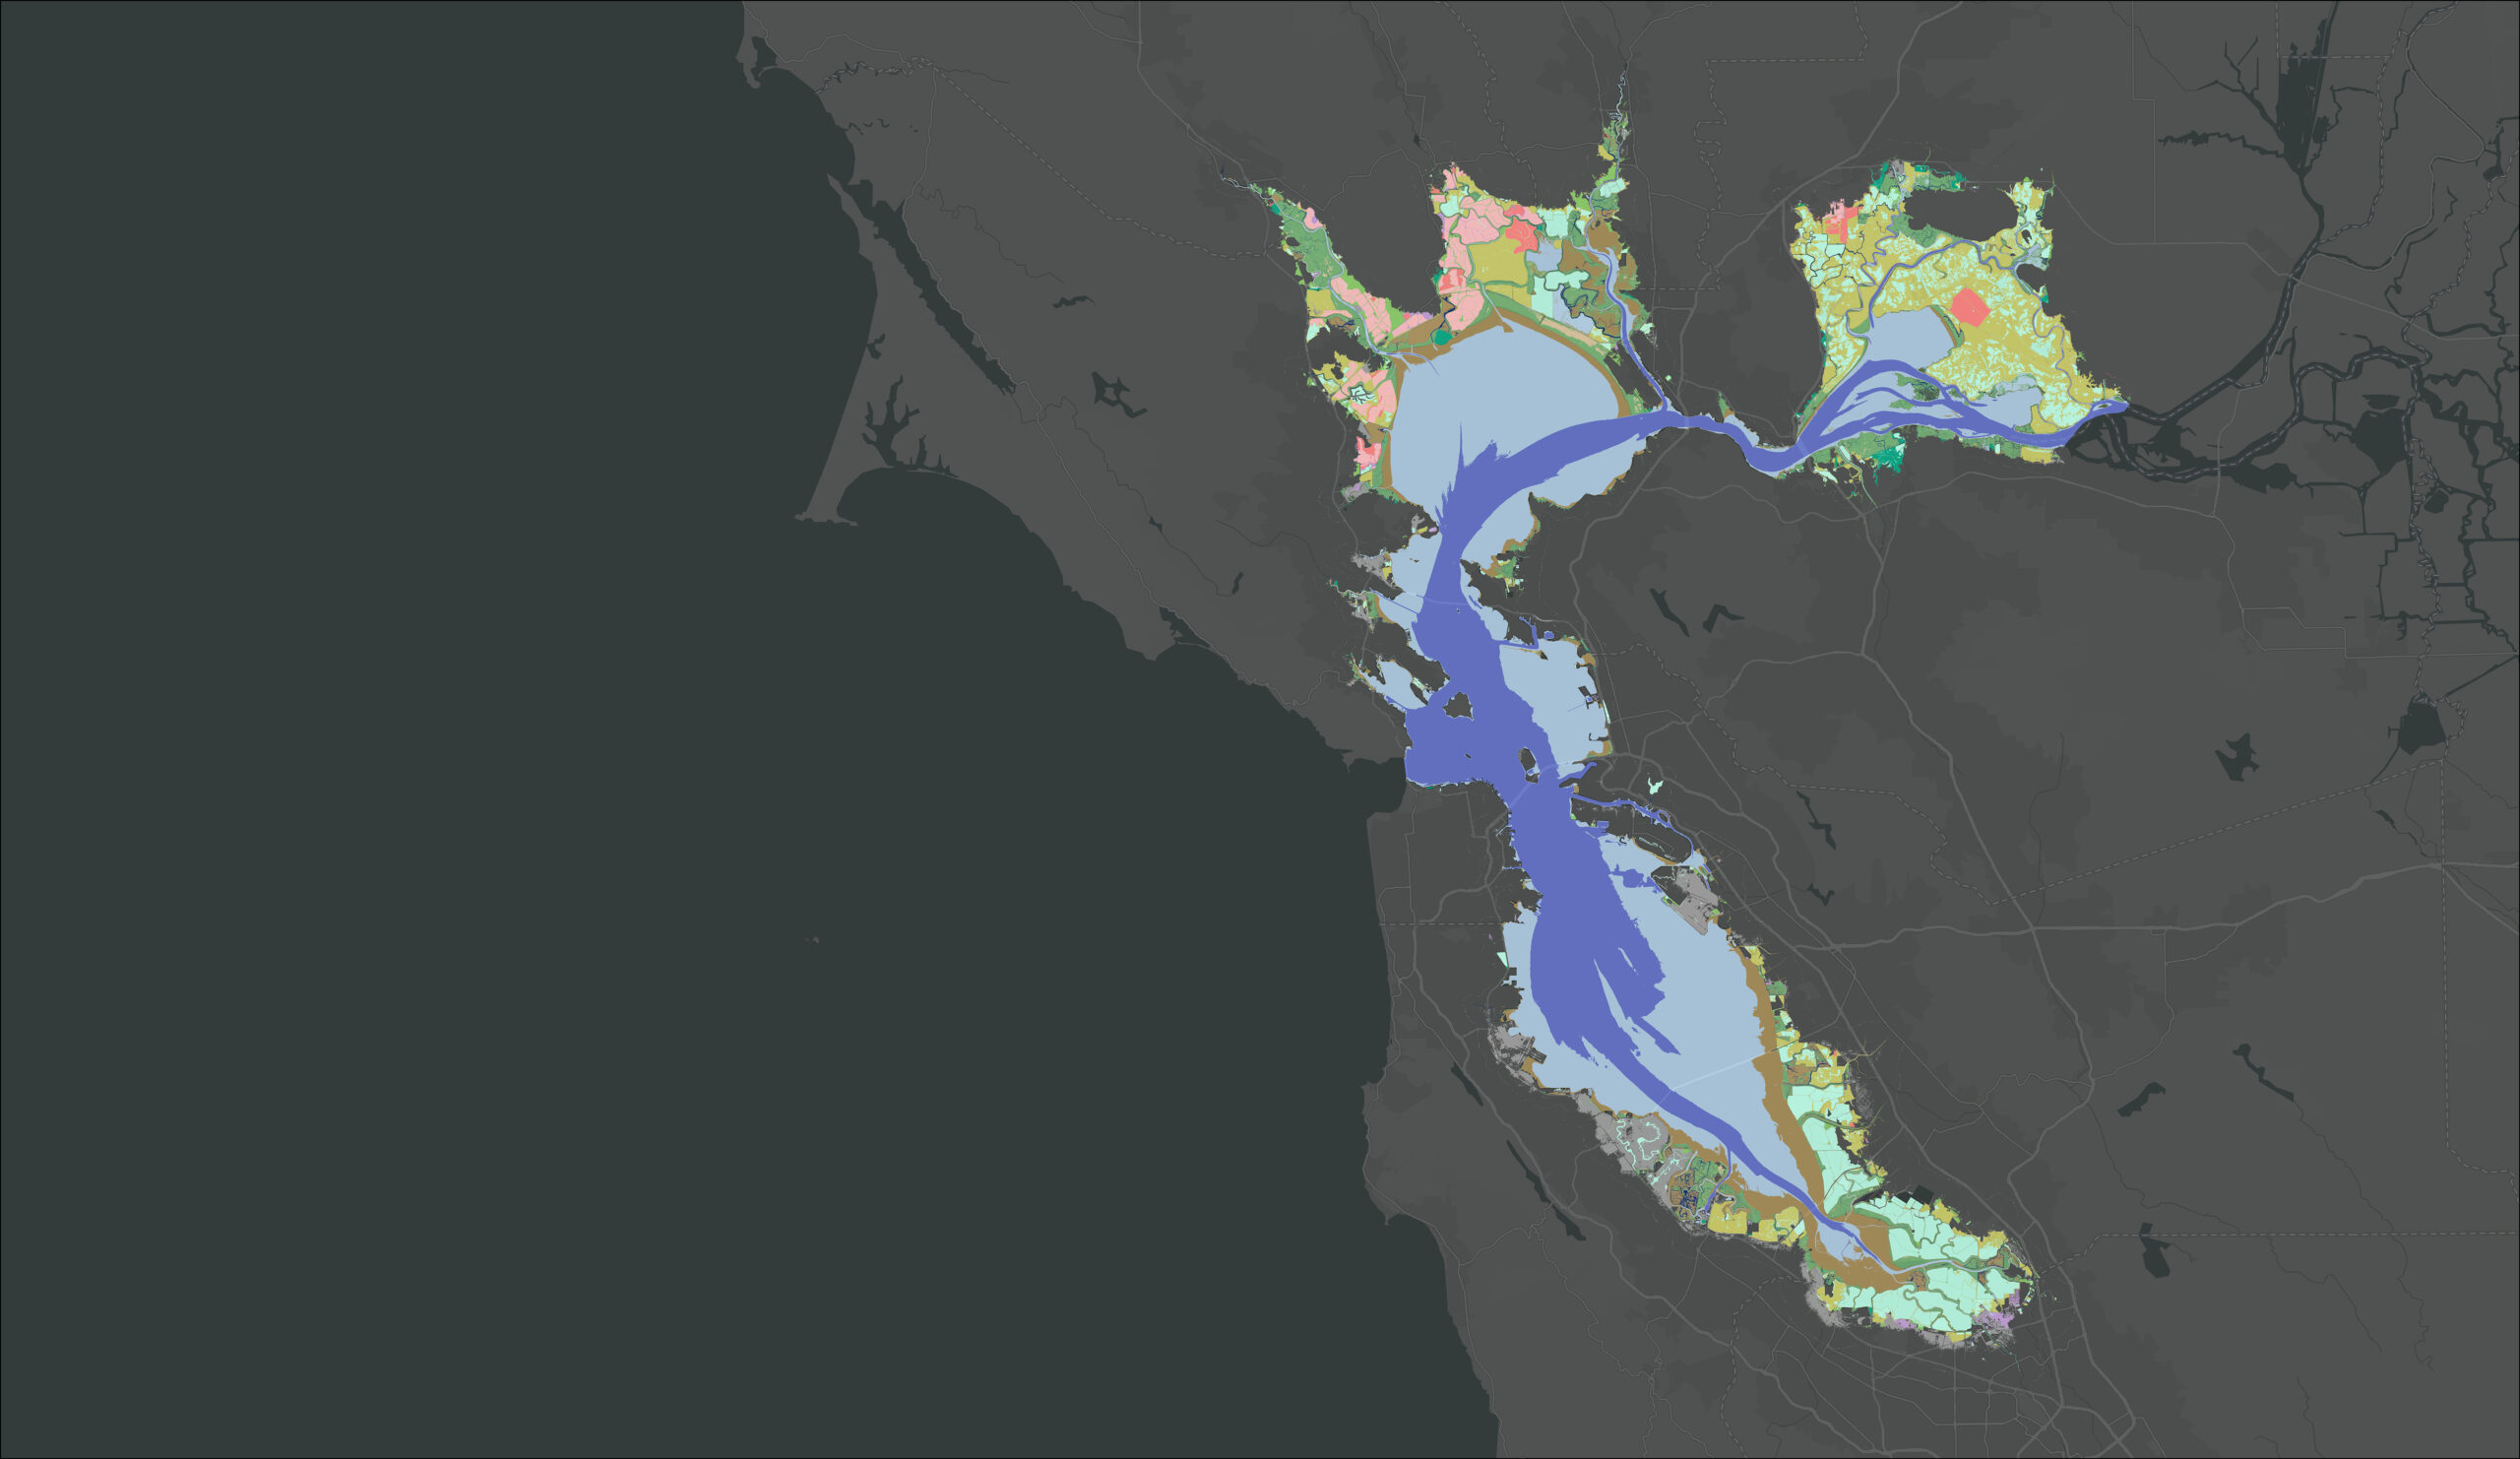
The WRMP developed the Baylands Habitat Map (BHM), using automated mapping technology to enhance accurate assessment of wetland acreage over time in a consistent and repeatable way.
1
2
3
4
Past tidal wetland mapping efforts (1998 and 2009) have been essential to understanding changes in the Bay and tracking our goal of reaching 100,000 acres of tidal marsh. The Baylands Habitat Map (BHM) 2020 is the first complete map of Bay wetland habitats produced since 2009. BHM 2020 incorporates the many changes in baylands distribution and abundance that have occurred over the last two decades and includes new information about land use that informs baylands restoration and management constraints and opportunities.
This mapping effort pairs high-resolution aerial imagery and tidal and elevation data with Object-Based Image Analysis (OBIA). By leveraging advancements in automated mapping and standardized habitat classes, the WRMP mapping team laid the groundwork for consistent mapping and accurate change detection. BHM mapping will be updated for 2025 conditions and then every 4-6 years. Repeated mapping over time allows the WRMP to measure changes in wetland habitats due to restoration, track losses in these habitats due to sea-level rise, capture the regional benefits of multiple individual projects, inform restoration science, and raise community awareness.
EcoAtlas Project Tracker is the most complete online data entry tool and database of California wetland restoration projects. Project Tracker provides standardized information involved in restoring habitats including habitat types, dates, acres, and any relevant events. Project Tracker is used by agency staff, scientists, resource managers, and NGOs.
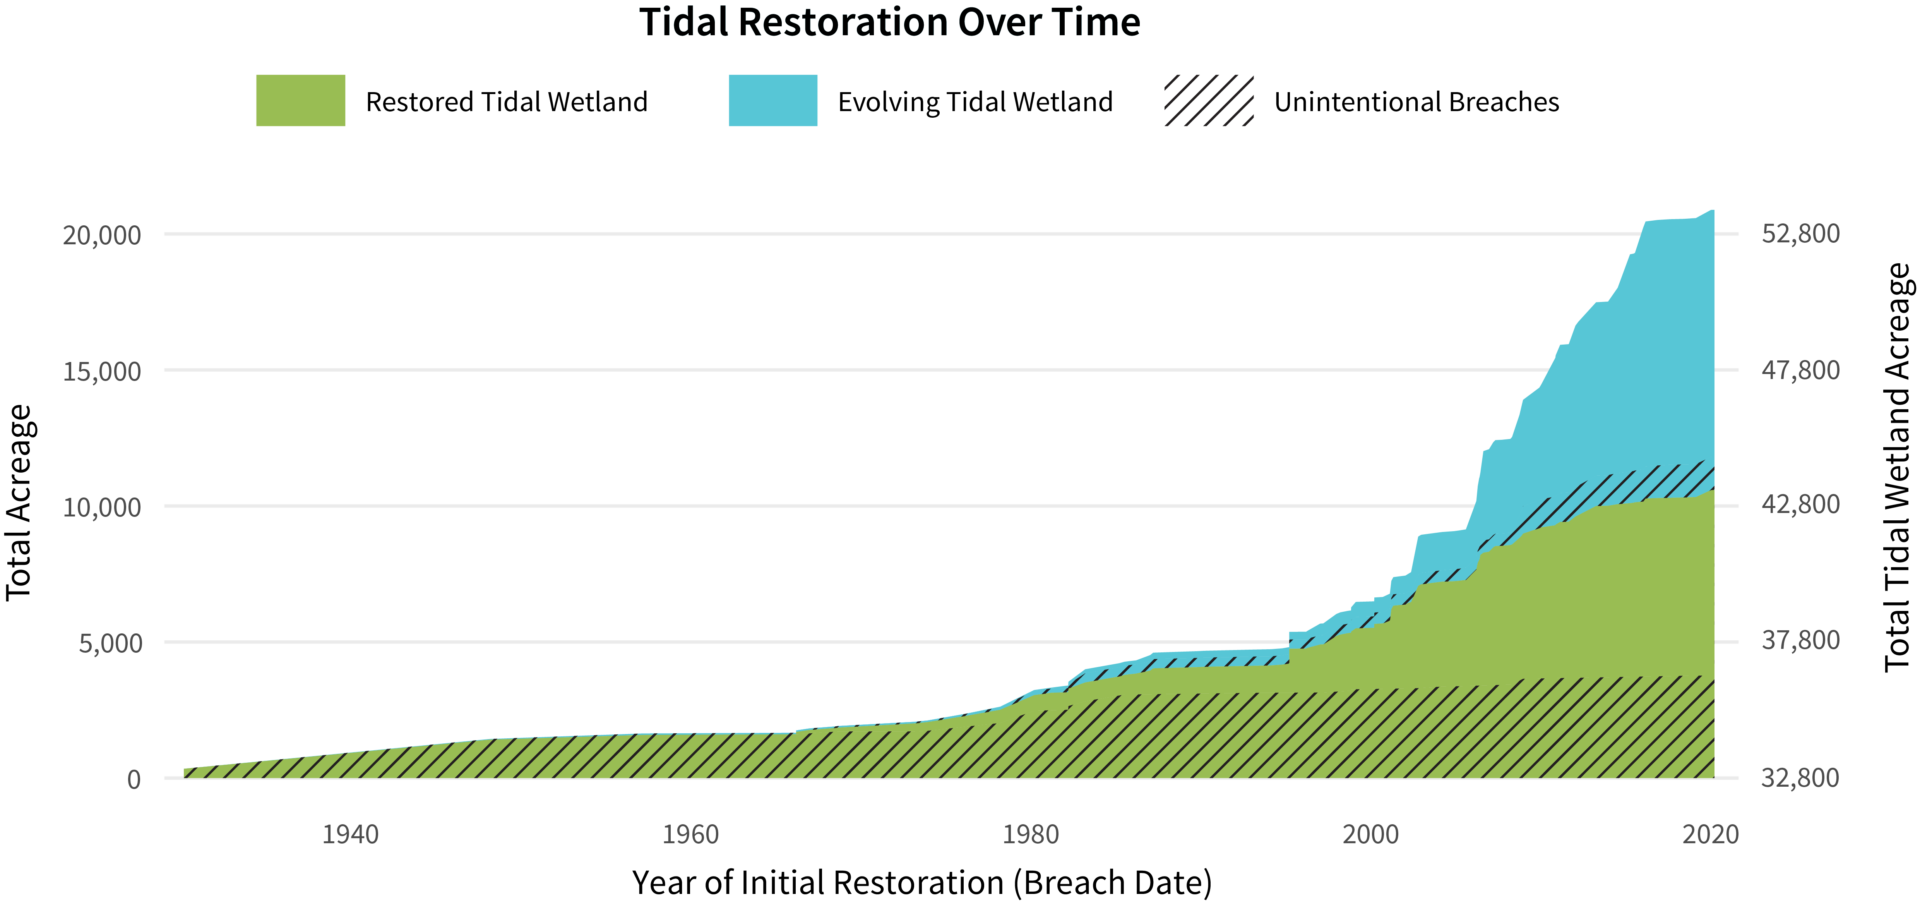
The WRMP has created new data products that represent the current state of tidal wetland restoration, starting with Project Tracker Tidal Wetland Restoration Map 2020 and 2024. These products address known issues of Project Tracker data by systematically reviewing and updating all records in a consistent effort for San Francisco Bay. By creating this standalone dataset, the WRMP packaged information from Project Tracker into a resource for the region’s restoration community that will be reviewed and updated annually. It is citable for clarity on how restoration estimates are being calculated and used for additional analyses to evaluate restoration progress and performance. This resource and the current acreages are described in detail in the Tidal Wetland Extent Report (2025).