Measuring wetland condition with California Rapid Assessment Method (CRAM) Estuarine Habitat Development Curve
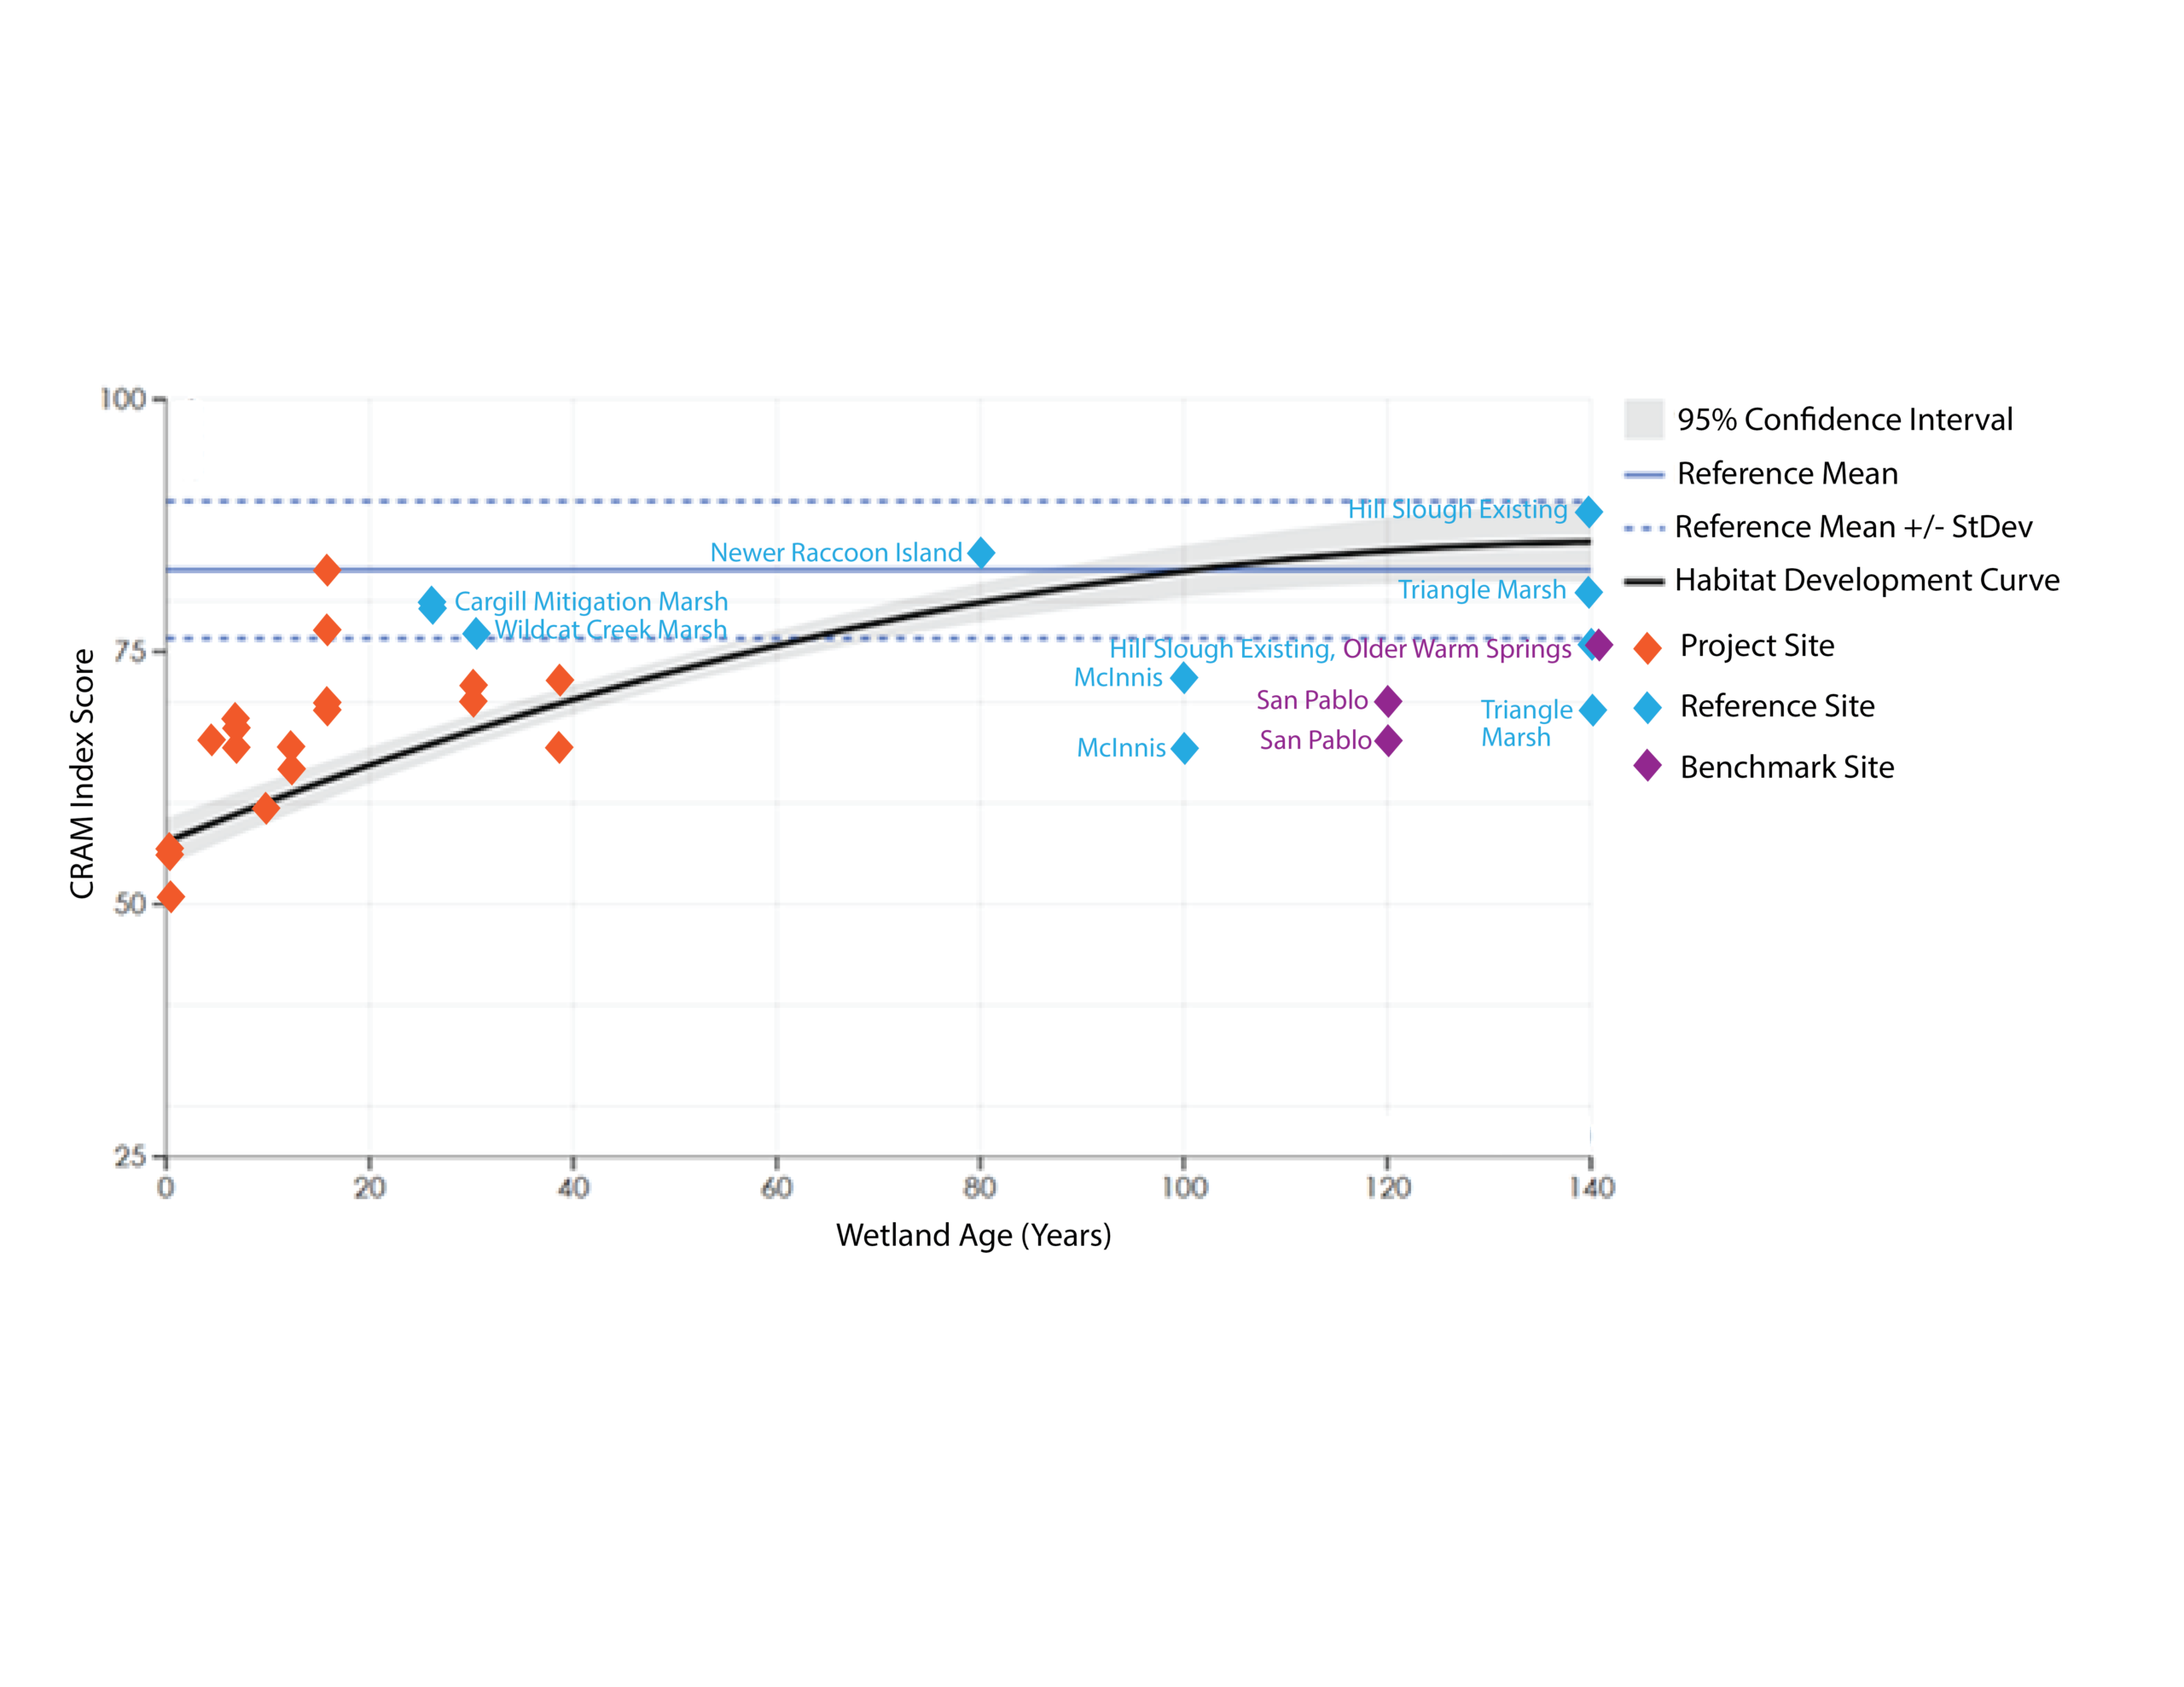
WRMP assesses wetland condition with the California Rapid Assessment Method (CRAM). A regional comparison of CRAM scores is used to generate a CRAM Habitat Development Curve (HDC, see graph). The HDC displays the expected rate of natural development in a tidal wetland restoration site in the San Francisco Estuary. CRAM scores plotting on or above the curve provide confidence that the wetland will continue to mature and reach reference site (a successful mature restored wetland) conditions. If scores plot below the curve, managers can explore the underlying CRAM sub component scores to identify potential adaptive management actions that might be implemented to improve the project. Comparison of CRAM scores on a HDC can also be used to forecast the expected ecological condition that a wetland restoration project will likely achieve at any given future date after project completion, or to estimate the number of years that it will take for a wetland to reach reference site conditions.
Downloads:
PNG
Science Framework
The creation of this metric is guided by our Science Framework Management Question(s):
- What is the distribution, abundance, and condition of tidal marsh ecosystems, and how are they changing over time?
Looking for local data and information?
Learn more about using CRAM to assess wetland condition in the 2024 CRAM survey report. See WRMP data by visiting EcoAtlas.