Surface Elevation Tables - Marker Horizons
Reduction in Bay sediments poses concern for tidal wetland persistence over time. Surface elevation tables (SETs) and marker horizons are used together to measure if tidal wetland elevations are increasing at a rate proportional to sea level rise. They are installed at multiple locations within a wetland to understand elevation variability within that given wetland.
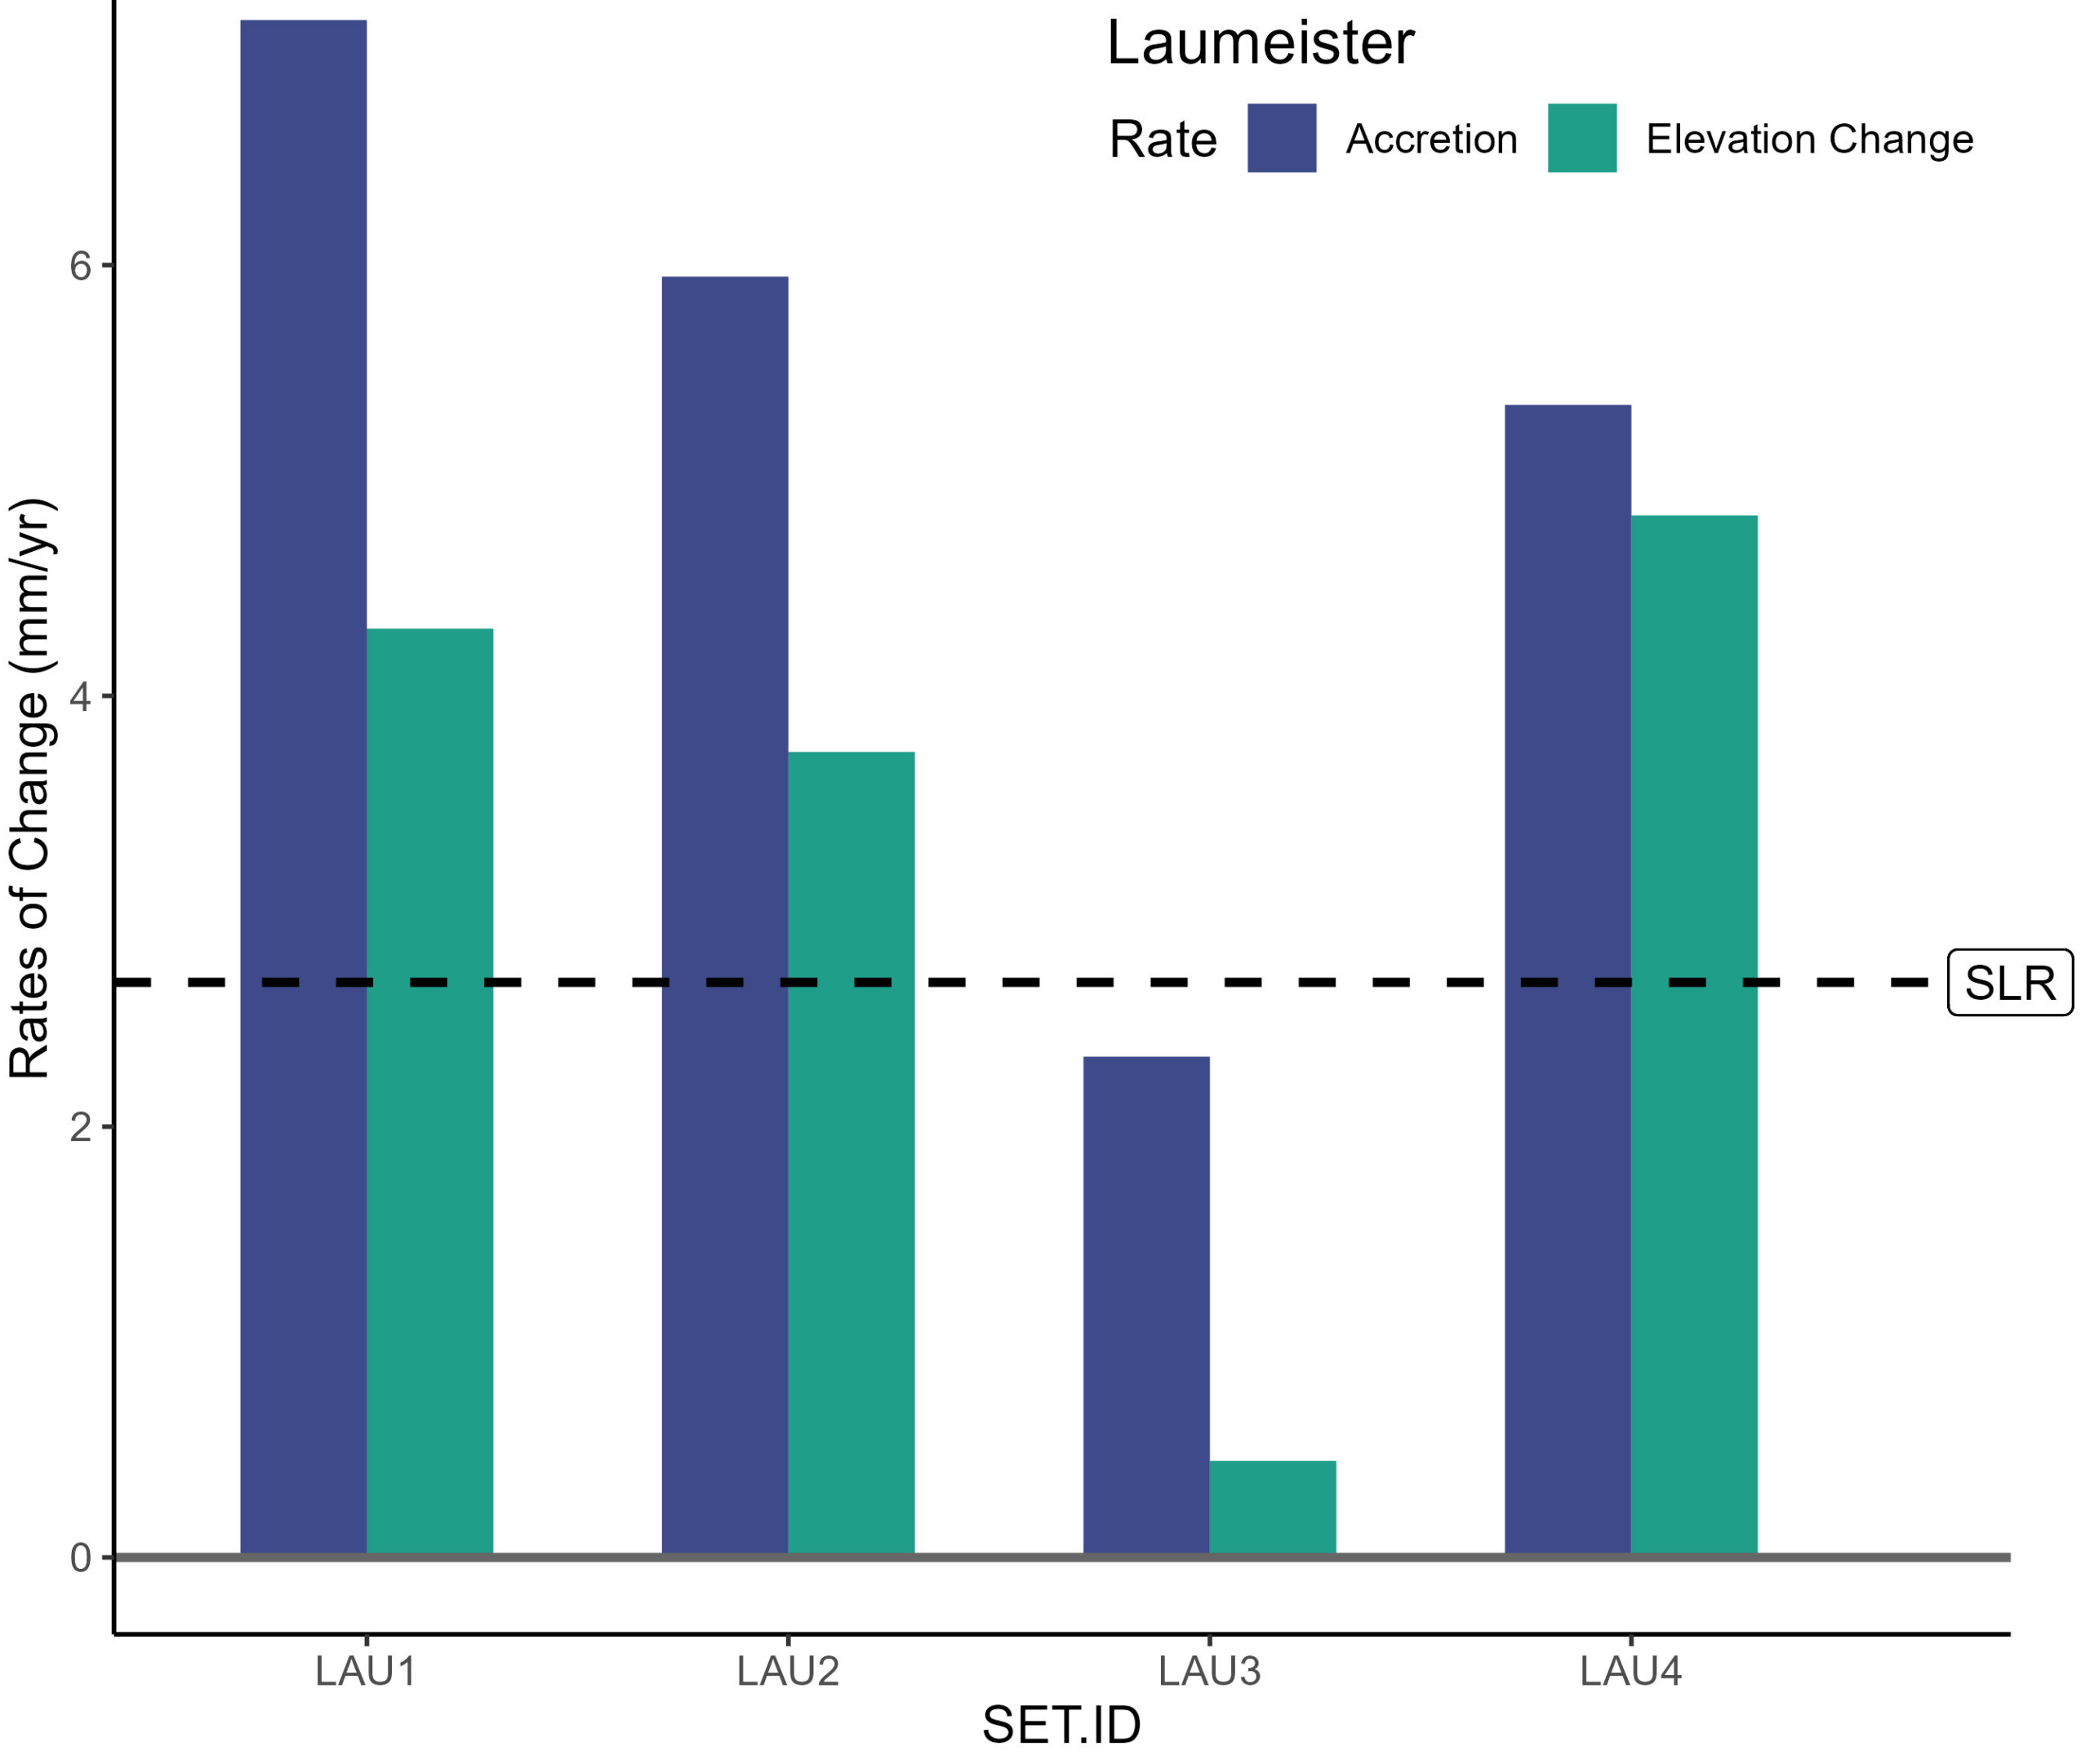
The graph shown here is an example of a site to illustrate what can be learned from this type of data. By precisely measuring the distance between the SET equipment and the marsh surface (to measure elevation change; teal bars in graph) and the depth of sediment deposited by tidal waters (to measure accretion; blue bars in graph) at the same location over time, researchers can calculate change rates and compare against the rate of sea level rise (dashed line in the graph). If this change is at or above this line , wetlands are keeping pace. If this change is below, however, the wetland is not keeping pace and this could result in either changes in vegetation to plants that can withstand longer periods of inundation or complete loss of vegetation. In this example, three of the four locations are gaining elevation well above the rate of sea level rise and one is not.
Downloads:
PNG
Science Framework
The creation of this metric is guided by our Science Framework Management Question(s):
- What is the distribution, abundance, and condition of tidal marsh ecosystems, and how are they changing over time?
- How are tidal marshes and tidal flats, including restoration projects, changing in elevation and extent relative to local tidal datums?
- What are the regional differences in the sources and amounts of sediment available to support accretion in tidal marsh ecosystems?
- Where and when can interventions, such as placement of dredged sediment, reconnection of restoration projects to watersheds, and construction of living shorelines, help to sustain or increase the quantity and quality of tidal marsh ecosystems?
Looking for local data and information?
Data are available at the WRMP Data Portal and at Sciencebase.gov.